Interpreting DEXA Scan Results: T-Score, Z-Score, and Body Composition
Interpreting Your DEXA Scan Results: T-Score, Z-Score, and Body Composition Explained
Last updated: June 2025
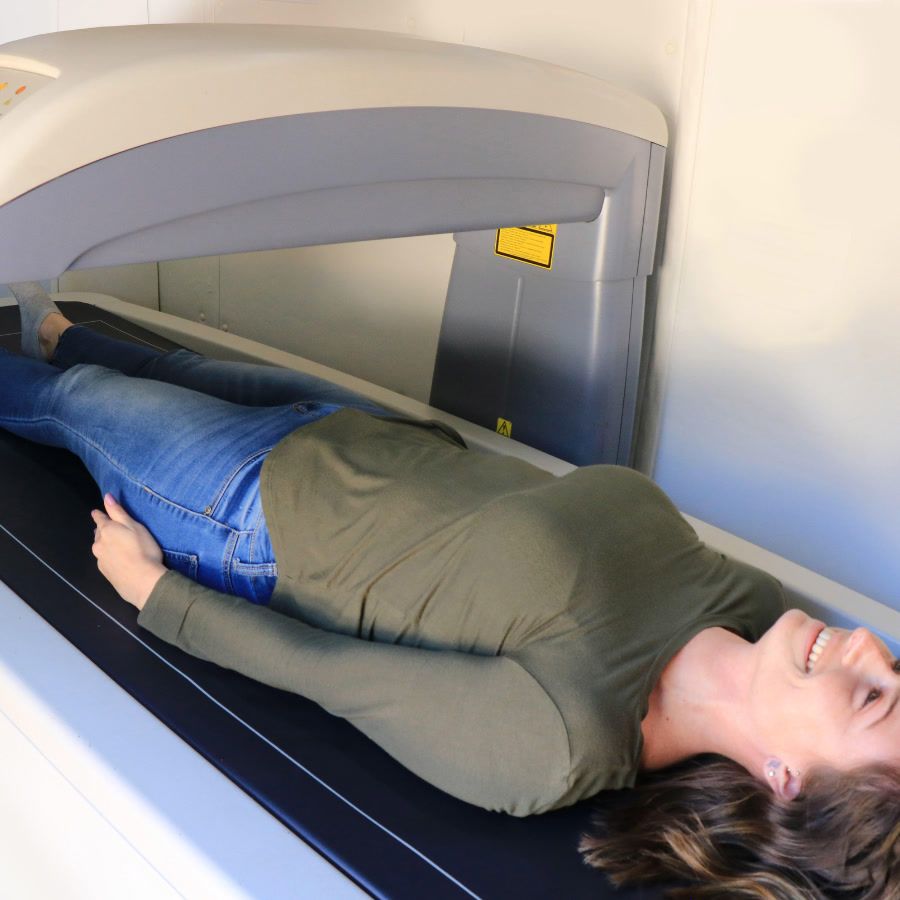
If you’ve recently received a DEXA report, you’ve probably noticed a page full of abbreviations, decimals, and color-coded graphs. This guide simplifies interpreting your DEXA scan results by explaining each key metric and showing how to turn those numbers into actionable health insights.
Diagnostic vs. Non-Diagnostic DEXA: Know Which Scan You Had
| Type of DEXA | Primary Purpose | How It’s Initiated | Can It Diagnose Osteopenia/Osteoporosis? | What Else It Measures |
|---|---|---|---|---|
| Non-Diagnostic Full-Body DEXA | Comprehensive body-composition analysis (body-fat %, visceral fat, lean mass, segmental data, plus an overall bone-density estimate) | Individuals book directly with clinics like BodySpec; no doctor’s order required | No – the bone-density number is informational only | Fat-mass %, lean-mass %, visceral fat, regional muscle-fat balance |
| Diagnostic (Axial) DEXA | Bone-density measurement of the hip, spine, and sometimes wrist for fracture-risk assessment | Physician-ordered; often covered by insurance after age 65 or with risk factors | Yes – generates T- and Z-scores that a doctor can use to diagnose bone conditions | Limited body-composition data |
Bottom line: BodySpec provides non-diagnostic full-body DEXA scans. You’ll still see an overall bone-density value, but only a physician-ordered diagnostic scan can officially label you as having osteopenia or osteoporosis.
Quick-Reference Cheat Sheet
| Metric | “Good” Range | “Caution” Range | “High-Risk” Range | What It Means |
|---|---|---|---|---|
| Total Body Fat % | 6–17 % (men) • 14–24 % (women) | 18–24 % • 25–31 % | ≥ 25 % • ≥ 32 % | Percentage of your body weight that is fat; higher levels elevate risk for diabetes, heart disease, and joint problems. |
| Visceral Fat Mass† (lb) | < 1 lb | 1–2 lb | > 2 lb | Deep abdominal fat stored around organs—higher amounts drive inflammation and metabolic disease. |
| T-Score | ≥ −1.0 | −1.1 to −2.4 | ≤ −2.5 | Number of standard deviations your bone density is above or below young-adult peak; lower scores mean weaker bones and higher fracture risk. |
| Z-Score | ≥ −1.0 | −1.1 to −1.9 | ≤ −2.0 | Compares your bone density to age-matched peers. A Z-score ≤ −2.0 is considered below expected for age by NIAMS. |
Sources: ACE body-fat guidelines; NIAMS bone-density explainer; visceral-fat area thresholds from Neeland et al., 2019 converted to approximate mass values using Hologic DEXA calibration tables.
† The < 1 lb “good” threshold corresponds to < 100 cm² VAT area reported in CT/MRI studies such as Neeland et al. Ranges of 1–2 lb (Caution) and > 2 lb (High-Risk) are BodySpec’s practical guidelines that tier increasing mass above this evidence-based baseline.
Why DEXA Is the Gold Standard for Body Insight
Dual-energy X-ray absorptiometry (DEXA) measures bone density and full-body composition. When technicians follow standardized protocols, scan-rescan error is as low as ± 1 % (Kutáč et al., 2019).
Even in athletic populations where tiny changes matter, DEXA still posts ± 1 % precision for fat and lean mass (Nana et al., 2015).
That level of accuracy dwarfs common tools like BMI, skin-fold calipers, or smart scales. For more on DEXA physics and safety, see Understanding DEXA Scans.
Decoding Body-Composition Metrics (Non-Diagnostic Focus)
1. Total Body Fat %
The American Council on Exercise (ACE) breaks body-fat into five categories. We’ve combined similar tiers for clarity:
| Category (ACE) | Men | Women |
|---|---|---|
| Athlete + Fitness (our “Good”) | 6–17 % | 14–24 % |
| Average (our “Caution”) | 18–24 % | 25–31 % |
| Obese (our “High-Risk”) | ≥ 25 % | ≥ 32 % |
Source: ACE Body-Fat Percentage Guidelines
• Good: Supports healthy hormone balance and performance.
• Caution: Still common, but creeping into metabolic-risk territory.
• High-Risk: Strongly linked to insulin resistance, cardiometabolic disease, and joint strain—time for a structured plan.
2. Visceral Adipose Tissue (VAT)
Visceral fat wraps your organs; excess VAT drives inflammation and insulin resistance. Staying below ≈ 1 lb (about 0.5 kg) aligns with the CT/MRI area threshold (~100 cm²) tied to low cardiometabolic risk in large cohort studies (Neeland et al., 2019).
3. Lean Mass & ALMI (What It Is and How to Calculate)
Appendicular Lean Mass Index (ALMI) is a helpful muscle-health marker that you can easily calculate using the data from your BodySpec report.
- Locate the lean-mass values for both arms and both legs (in pounds) on your report and sum them.
- Convert that total limb lean mass from pounds to kilograms: limb lean mass (lb) ÷ 2.2046 = kg.
- Convert your height from inches to meters: height (inches) ÷ 39.37 = meters.
- Square your height in meters: height (m) × height (m) = m².
- Calculate ALMI: limb lean mass (kg) ÷ height (m²).
EWGSOP2 sarcopenia cut-offs: ALMI < 7.0 kg/m² for men and < 5.5 kg/m² for women suggests low muscle mass when paired with weak grip strength or slow gait speed (Cruz-Jentoft et al., 2019).
Decoding Bone-Density Numbers (Diagnostic Context)
Only a physician-ordered diagnostic DEXA can diagnose bone disease. If your BodySpec scan flags a low score, bring it to your doctor.
1. T-Score: How Do You Stack Up Against Peak-Bone Adults?
| T-Score | WHO Category | Approx. Fracture Risk† |
|---|---|---|
| ≥ −1.0 | Normal | Baseline |
| −1.1 to −2.4 | Osteopenia | 2–4 × |
| ≤ −2.5 | Osteoporosis | ≥ 5 × |
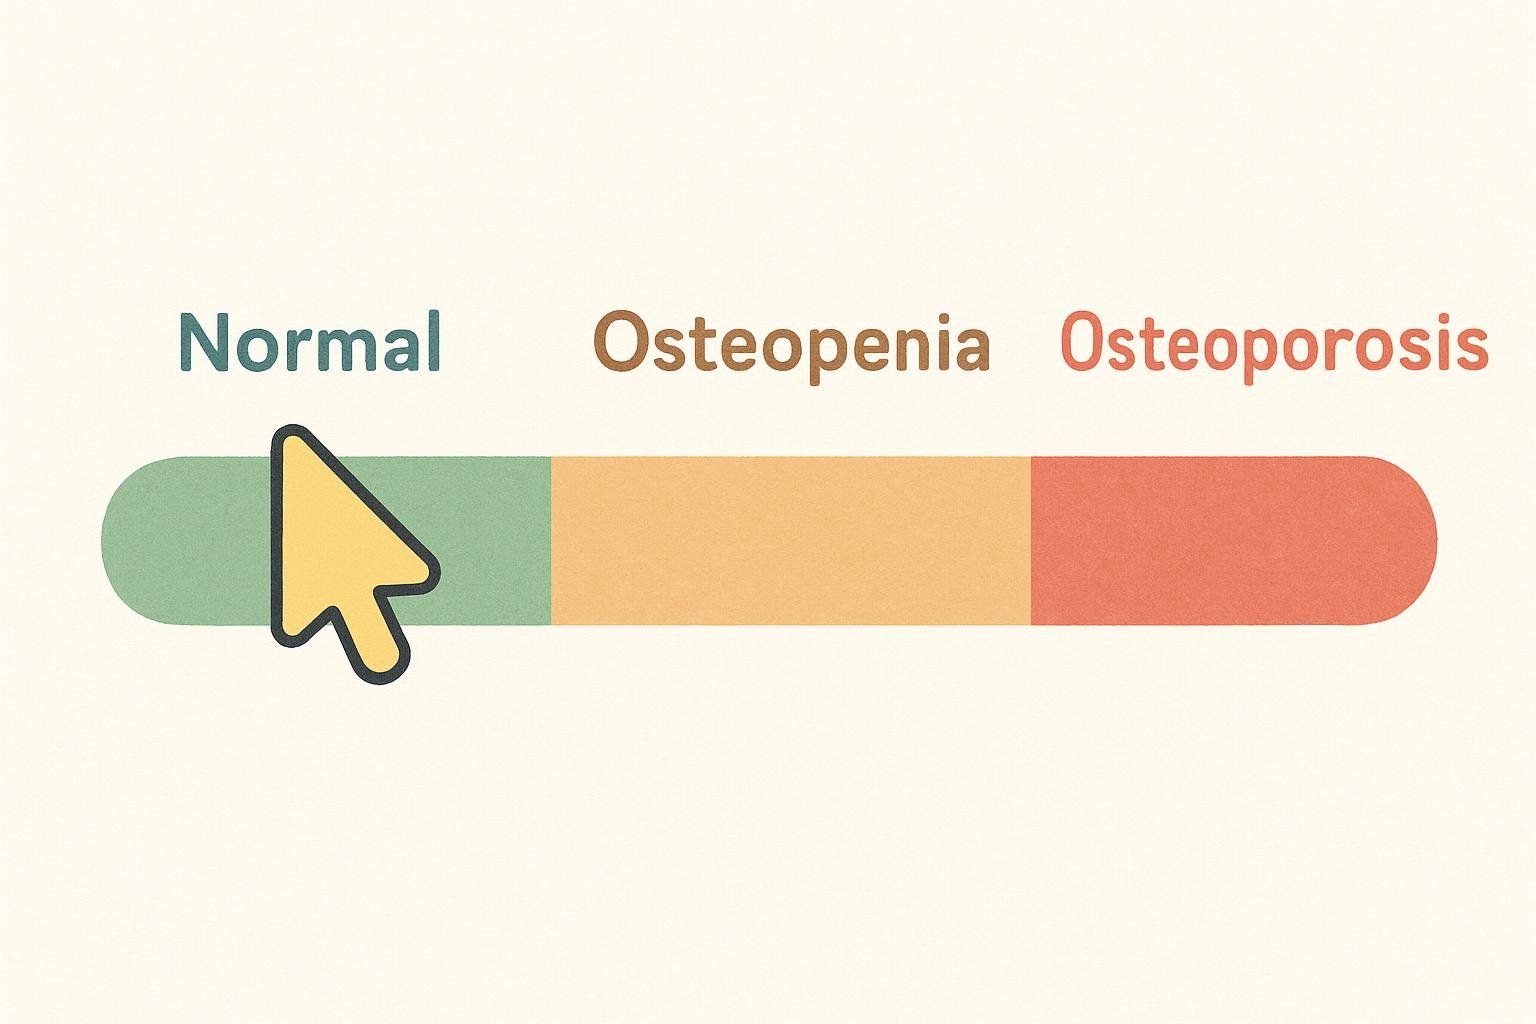
Source: World Health Organization, Technical Report 843 (1994).
† Fracture risk roughly doubles per standard-deviation drop in BMD (Marshall et al., 1996).
What now? If you’re in osteopenia or osteoporosis, discuss calcium/Vit D, strength training, and medication options with your doctor. Our strength-training guide for better bone density can help.
2. Z-Score: Are Your Bones Low for Your Age?
A Z-score below −2.0 may signal underlying conditions (e.g., endocrine disorders, steroid use). A normal Z-score shows bone density typical for your peers but doesn’t erase fracture risk.
3. Trabecular Bone Score (TBS)
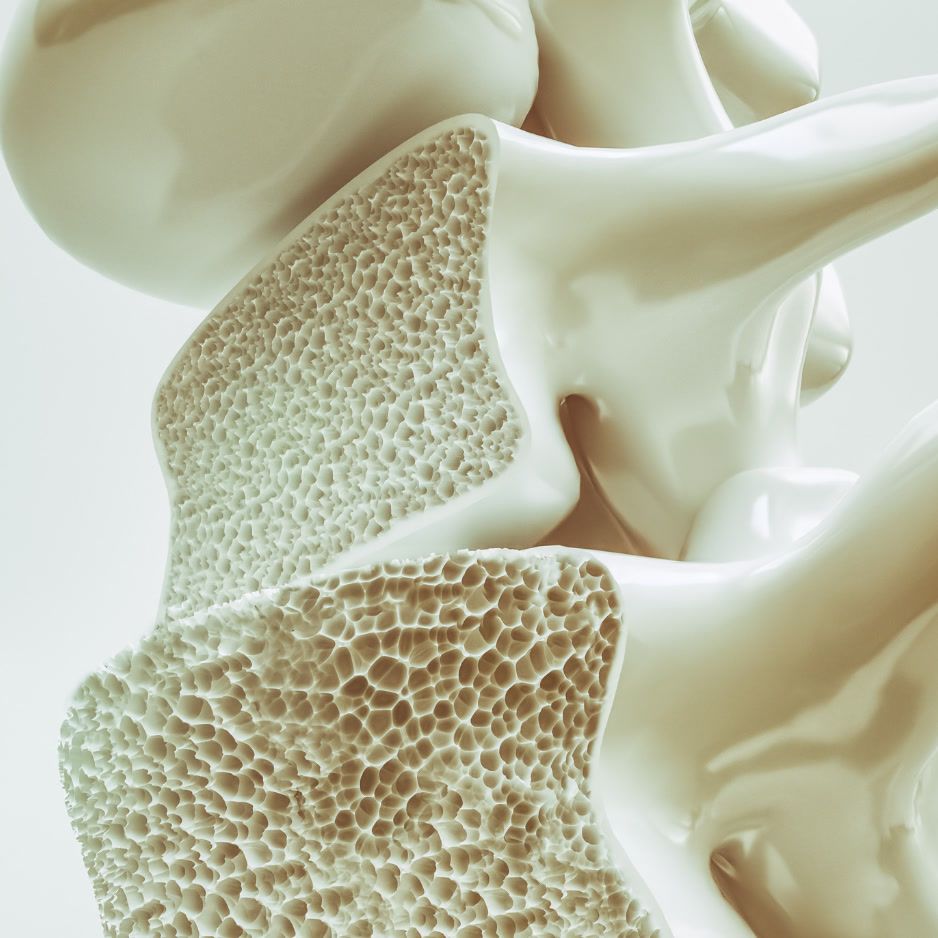
TBS analyzes the lumbar-spine DEXA image to estimate bone micro-architecture—the “internal scaffolding” of your vertebrae.
| TBS | Interpretation |
|---|---|
| ≥ 1.350 | Healthy microarchitecture |
| 1.200–1.349 | Partially degraded |
| < 1.200 | Degraded |
TBS can adjust FRAX fracture estimates and reveal hidden fragility when T-scores look borderline (ISCD 2019).
4. BMD (g/cm²): The Raw Number
Bone Mineral Density (BMD) is the measurement of mineral content per square centimeter of bone (g/cm²). Higher BMD generally reflects stronger, more fracture-resistant bone. BMD values are site-specific—common scan sites include the lumbar spine, femoral neck, total hip, and forearm. Physicians often enter femoral-neck BMD into the FRAX tool to estimate 10-year fracture probability.
Region-by-Region Breakdown
| Region | Why It Matters |
|---|---|
| Lumbar Spine | Early post-menopausal bone-loss indicator |
| Femoral Neck / Total Hip | Best hip-fracture predictor; FRAX input |
| Forearm | Alternative if hip/spine unusable |
| Android Area | Key area for visceral adipose tissue (VAT) accumulation |
| Gynoid Area | Fat storage in hips and thighs; associated with a more favorable metabolic profile in women |
| Arms & Legs | Tracks appendicular muscle (sarcopenia) |
Turning Numbers Into an Action Plan
Visceral Fat > 1 lb (Caution or High-Risk)
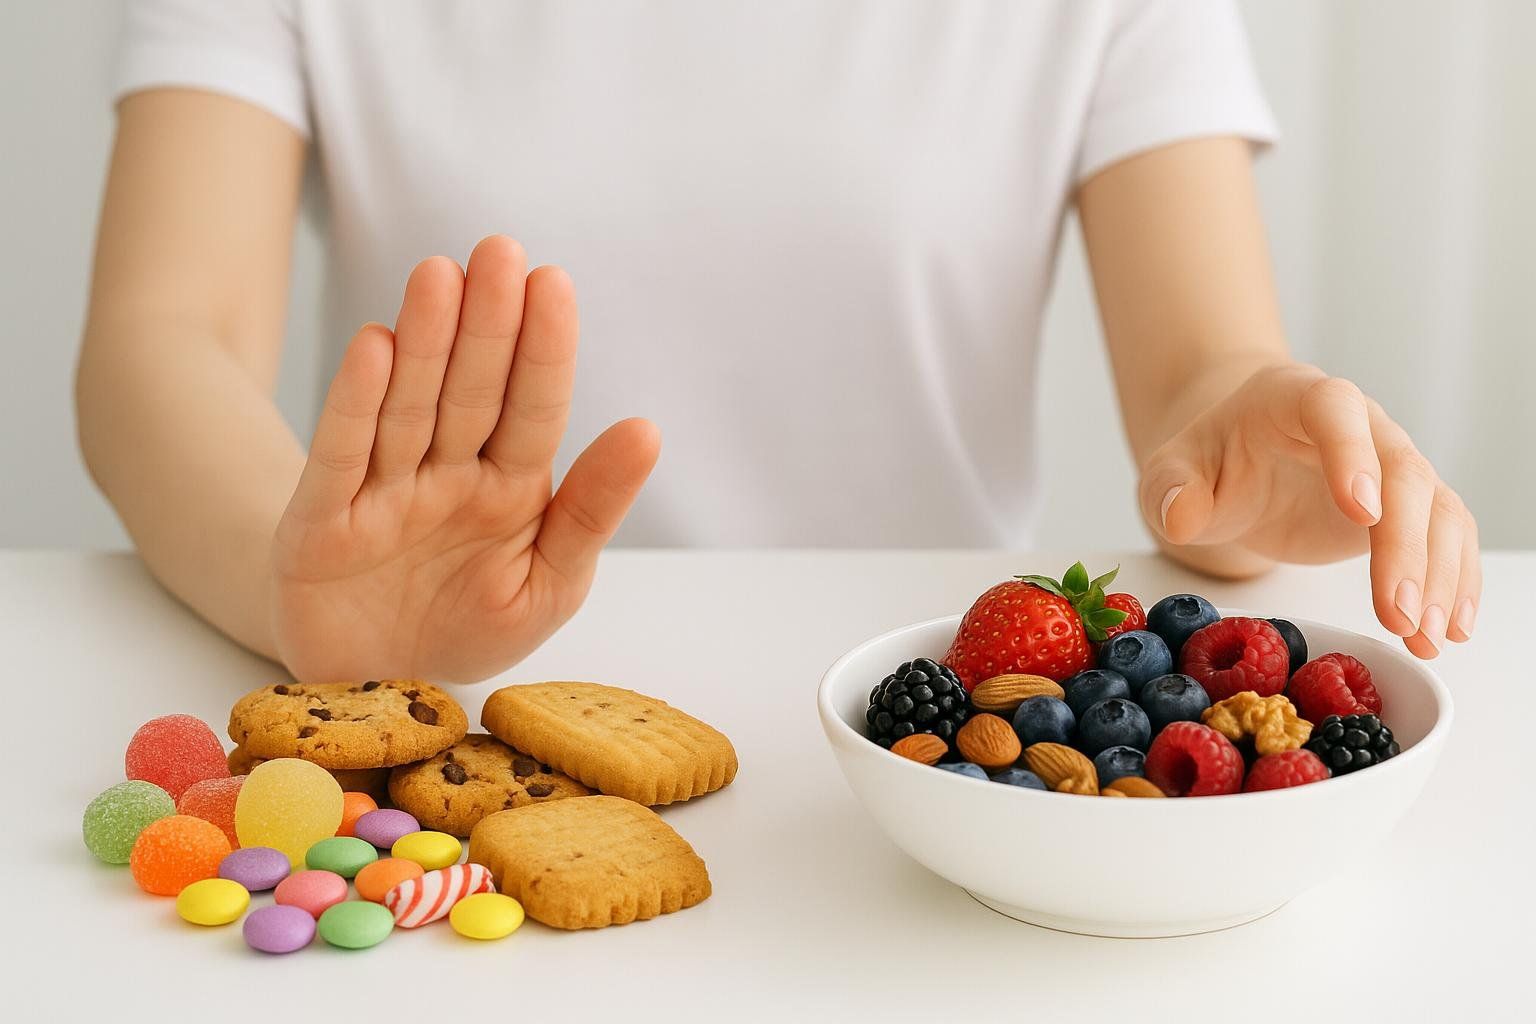
Cut added sugars and ultra-processed foods; explore effective cardio strategies like HIIT vs LISS for fat loss; and coordinate a personalized plan with a dietitian or physician.
Low ALMI
Aim for 0.7 g protein per lb body weight (~ 1.6 g/kg) to maximize muscle-protein synthesis (Morton et al., 2018). Pair that with our beginner’s guide to strength training and re-scan every 3–6 months.
Osteopenia (T-Score −1.1 to −2.4)
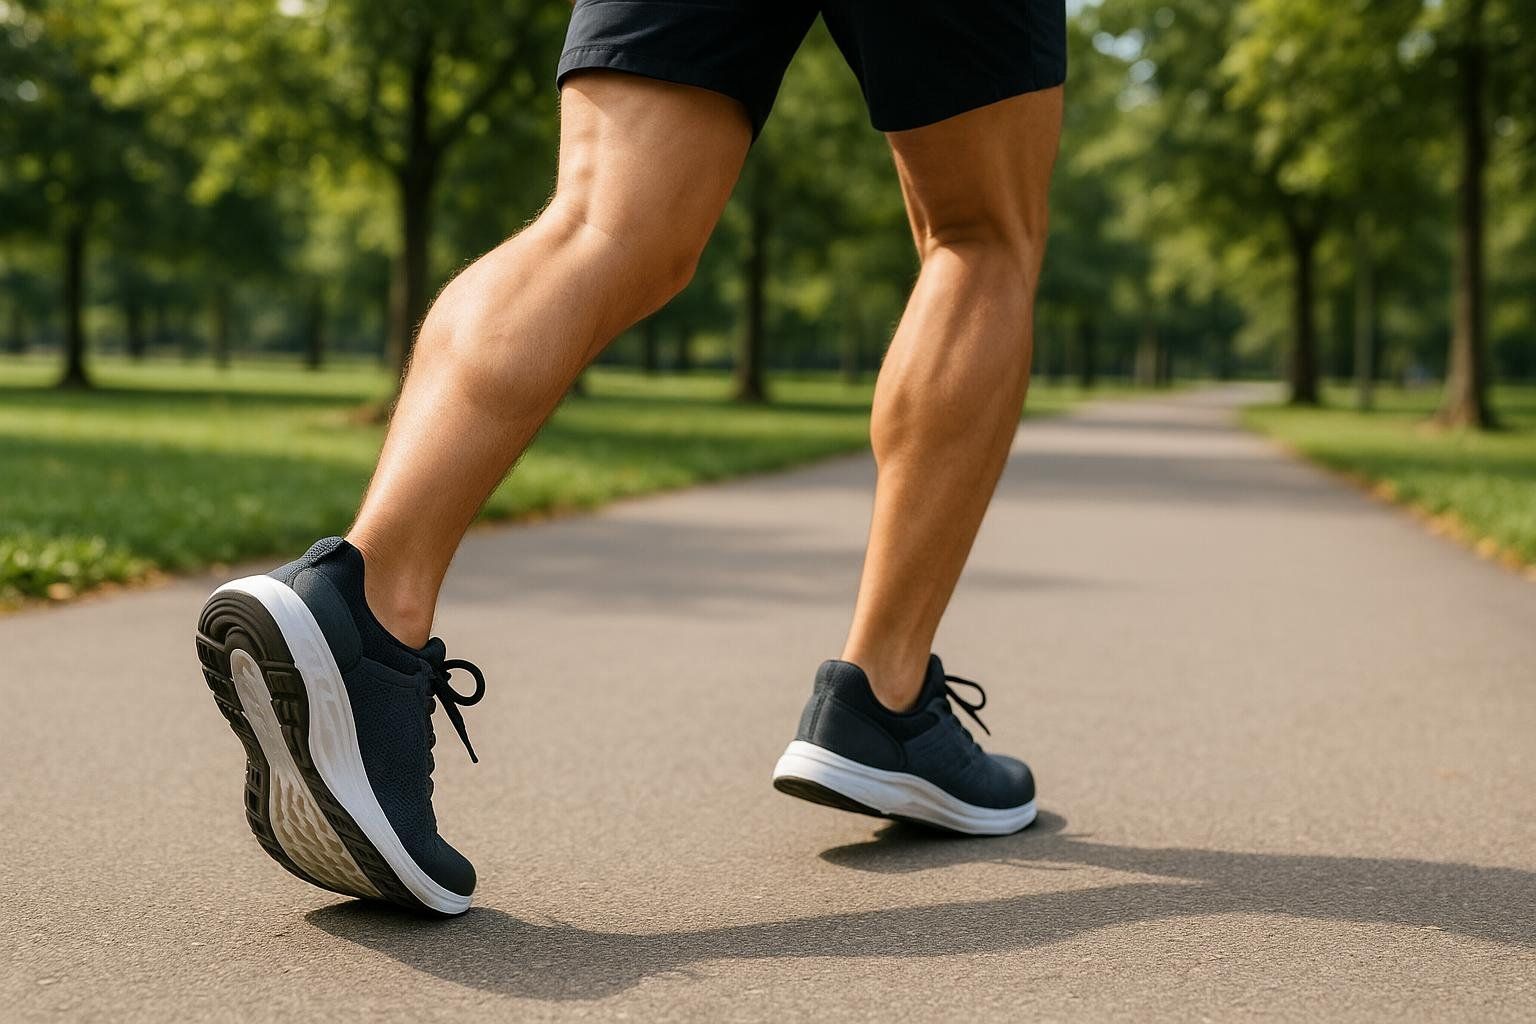
- Weight-bearing cardio.
- Resistance training 2–3 ×/week.
- 1,200 mg calcium + 800 IU Vit D (Bone Health & Osteoporosis Foundation).
- Discuss follow-up scan timing with your physician; USPSTF notes evidence is insufficient to define optimal intervals (USPSTF 2023).
Osteoporosis (≤ −2.5)
Discuss medications, ensure home safety, and pursue supervised progressive resistance training.
Frequently Asked Questions
How often should I repeat a DEXA scan?
For diagnostic bone-density testing, the U.S. Preventive Services Task Force states there is insufficient evidence to recommend specific screening intervals (USPSTF 2023). For non-diagnostic body-composition tracking, many BodySpec clients find value in scans every 1–3 months to monitor progress in fat loss or muscle gain, thanks to DEXA’s high precision and very low radiation dose.
Why do hip and spine scores differ?
Bones remodel at different rates; arthritis can falsely elevate spine BMD.
Can weightlifting improve my T-score?
Yes—1–3 % BMD gains over 12 months are common with resistance + impact training (Zhao et al., 2015).
Does DEXA radiation add up?

A scan gives ~ 5–10 µSv—about the same dose as eating four bananas. See detailed information on DEXA scan radiation safety.
Key Takeaways
- Non-diagnostic full-body DEXA (BodySpec) excels for body-composition tracking.
- Diagnostic DEXA is needed for official bone-health diagnoses.
- T-Score, Z-Score & TBS cover bone quantity and quality; VAT & Lean-Mass add metabolic and muscular context.
- Action beats anxiety—exercise, nutrition, and, when needed, medication can shift your numbers.
Ready to see where you stand? Book your next BodySpec DEXA scan today and get data you can act on.
Disclaimer: Educational content only; consult a qualified clinician for personal advice.
Selected Sources
• American Council on Exercise (ACE). Body-Fat Percentage Guidelines
• Bone Health & Osteoporosis Foundation. Calcium and Vitamin D: A Guide to Bone Health (2016).
• Cruz-Jentoft, A.J. et al. “Sarcopenia: Revised EWGSOP2 Definition.” Age & Ageing 48 (2019): 16-31.
• International Society for Clinical Densitometry (ISCD). Official Positions – Adult 2019.
• Kutáč, P. et al. “Whole-body dual-energy X-ray absorptiometry precision in college-aged adults.” Acta Gymnica 49 (2019): 19-25.
• Marshall, D. et al. “Meta-analysis of How Well Measures of Bone Mineral Density Predict Fracture.” BMJ 312 (1996): 1254-1259.
• Morton, R.W. et al. “Effect of Protein Supplementation on Resistance Training-Induced Gains.” Br. J. Sports Med. 52 (2018): 376-384.
• Nana, A. et al. “Using Dual-Energy X-Ray Absorptiometry for the Assessment of Body Composition in Athletes.” Int. J. Sport Nutr. Exerc. Metab. 25 (2015): 198-215.
• NIAMS. “Bone Mineral Density Tests: What the Numbers Mean.” (Page last reviewed: October 2022)
• Neeland, I.J. et al. “Visceral and Ectopic Fat, Atherosclerosis, and Cardiometabolic Disease.” Lancet Diabetes Endocrinol. 7 (2019): 715-725.
• U.S. Preventive Services Task Force. “Screening for Osteoporosis to Prevent Fractures.” (2023)
• World Health Organization. Assessment of Fracture Risk and Its Application to Screening for Postmenopausal Osteoporosis. Technical Report 843, 1994.
• Zhao, R. et al. “Resistance Training Modes and Bone Mineral Density.” Osteoporosis Int. 26 (2015): 1605-1618.
