Body Fat Percentage Chart for Men
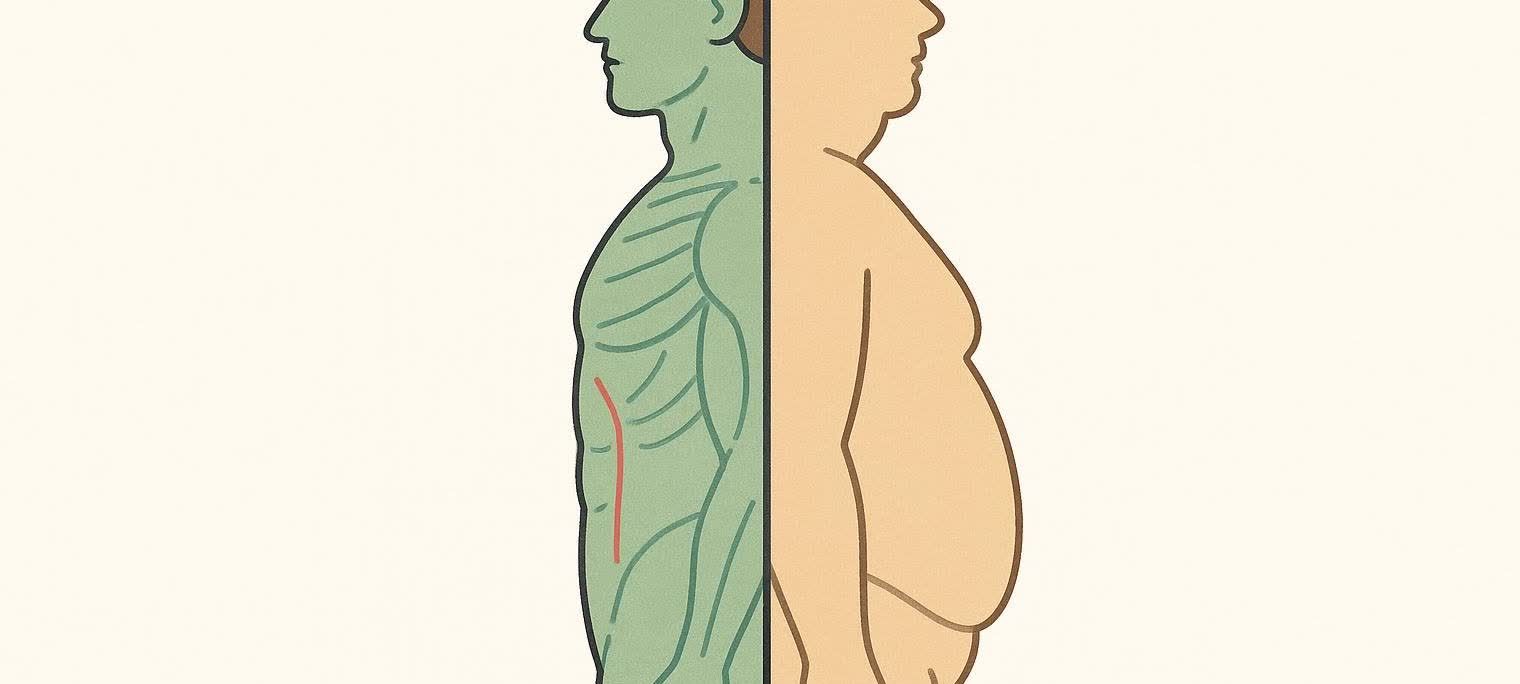
Body Fat Percentage Chart for Men: Visual Guide & Age Ranges
TL;DR
• Healthy range: Most men thrive around 12–20% body fat—the sweet spot shifts slightly higher with age, as the chart below shows.
• What 15% looks like: Flat waist, faint upper-ab outline, some arm vascularity—athletic yet sustainable.
• What 20% looks like: Softer mid-section, little ab definition; still average, not automatically obese.
• High BMI but lean? Muscle is dense. A DEXA scan reveals whether a high BMI comes from lean mass rather than fat.
Ever step on the scale, see a “normal” weight, yet still feel out of shape—or the opposite, get labeled “overweight” by BMI even though you’re all muscle? That frustration boils down to one thing: the scale can’t tell muscle from fat. Body-fat percentage can. It measures how much of you is fat versus everything else and, unlike BMI, it paints a far clearer picture of health and aesthetics. The chart below breaks down optimal male body-fat ranges by age and shows what those numbers look like in real life.
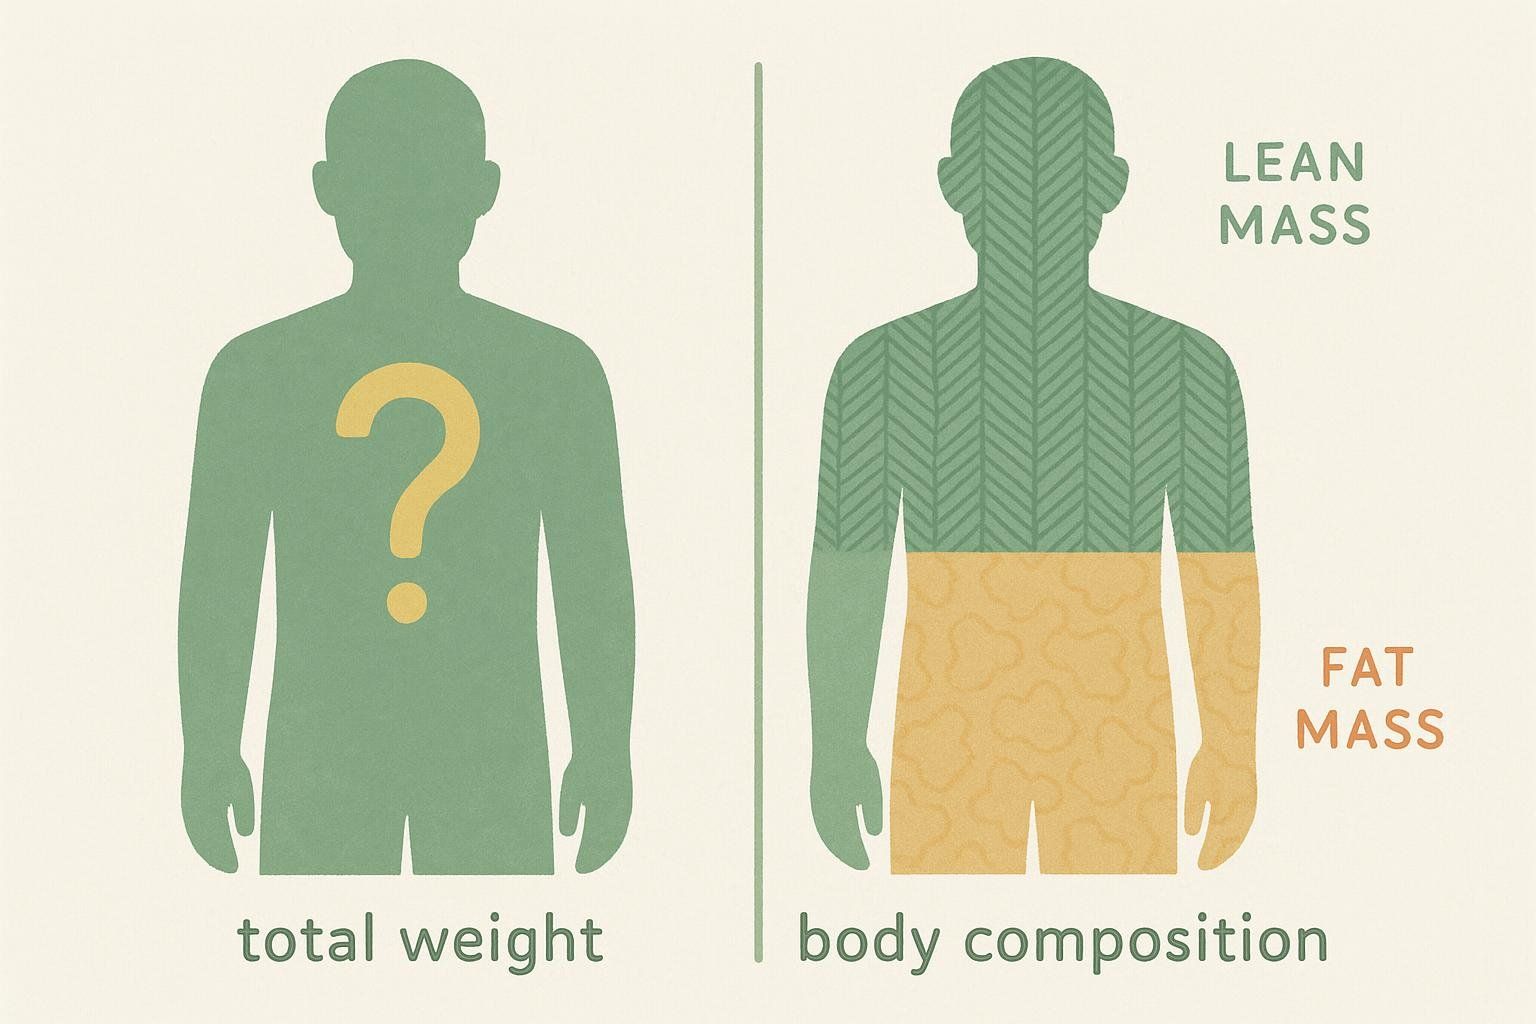
Body Fat Percentage Chart for Men by Age
| Age | Essential | Athletic | Healthy | Average | Obese |
|---|---|---|---|---|---|
| 20–29 | 2–5% | 6–11% | 12–16% | 17–23% | ≥24% |
| 30–39 | 2–5% | 6–12% | 13–17% | 18��–24% | ≥25% |
| 40–49 | 2–5% | 7–13% | 14–18% | 19–25% | ≥26% |
| 50–59 | 2–5% | 8–14% | 15–19% | 20–26% | ≥27% |
| 60+ | 2–5% | 9–15% | 16–20% | 21–27% | ≥28% |
Sources: American Council on Exercise body-fat norms and CDC NHANES body-fat statistics.
How to Use This Chart
- Measure accurately—ideally with a gold-standard DEXA scan.
- Locate your age row and current fat-percentage column.
- Set a realistic next-stop goal (one column left is a great 3- to 6-month target for most men).
- Re-test every quarter to keep progress data-driven.
Need a precise baseline? Book a BodySpec DEXA scan and get fat, lean, bone, and visceral-fat data in under 10 minutes.
Why Age Matters
Men naturally lose muscle mass—about 3–8% per decade after 30, according to a review on age-related muscle loss. Hormonal shifts also make fat storage easier. Staying in the Healthy column helps keep visceral fat low—a 2022 JAMA Cardiology study linked lower visceral fat to dramatically reduced cardiometabolic risk.
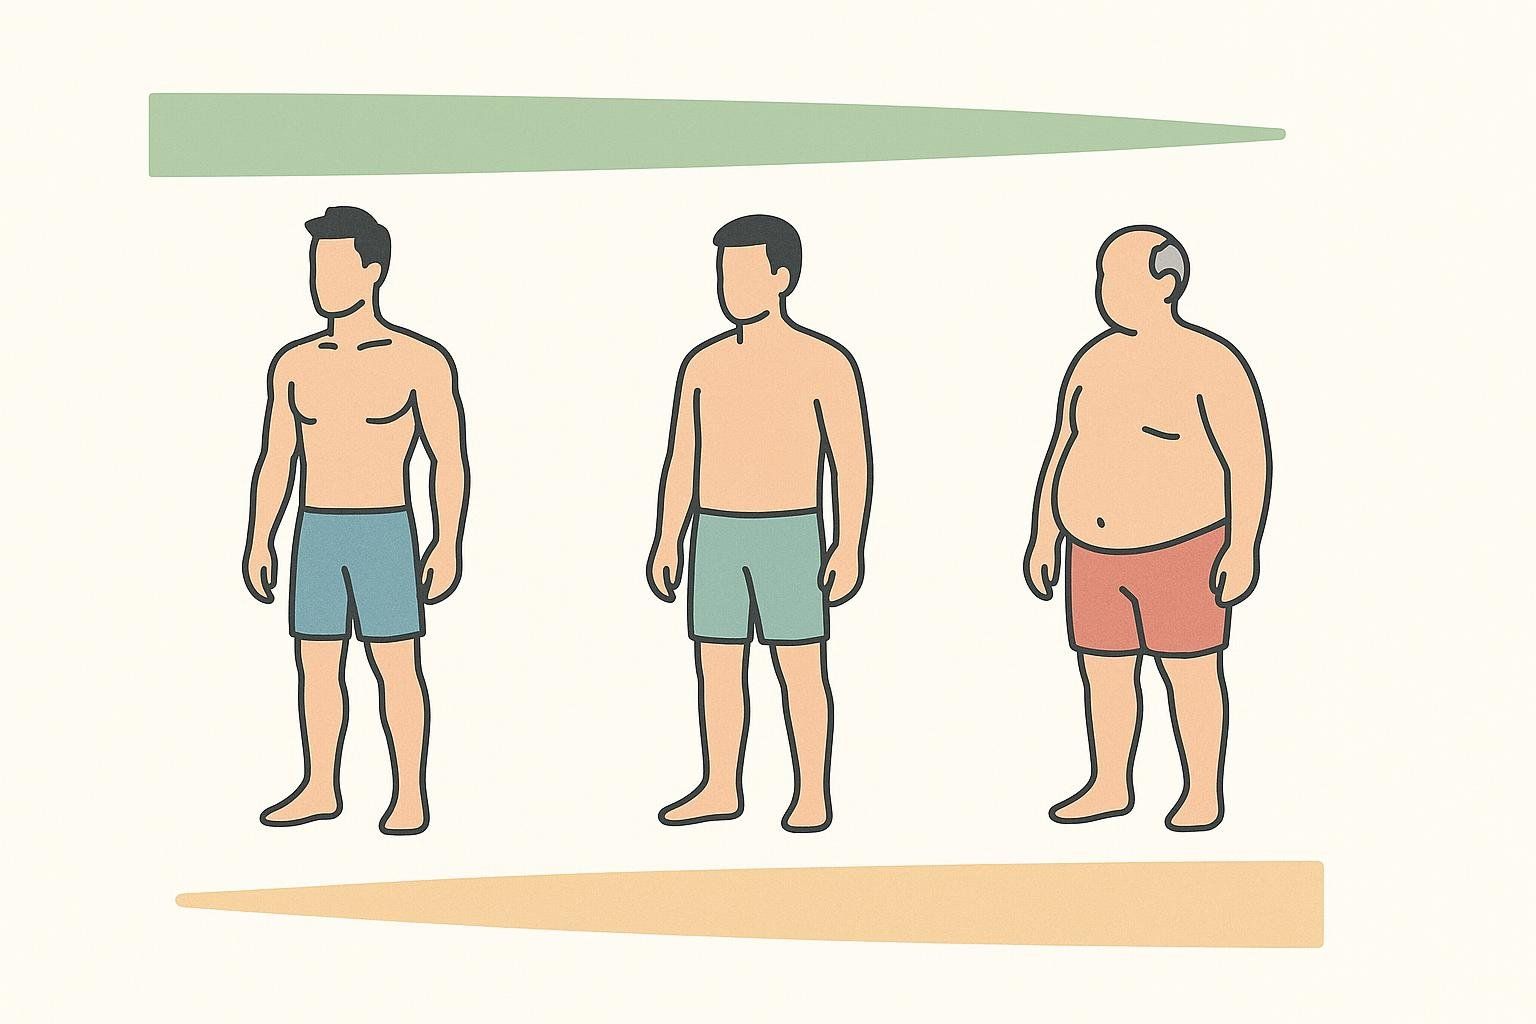
What Each Category Looks & Feels Like
| Category | Physical Appearance† | Typical Health Markers | Everyday Experience |
|---|---|---|---|
| Essential | Veins visible on arms & abs; pronounced muscle striations | Potential for low testosterone & impaired thyroid function | Energy can dip if maintained too long |
| Athletic | 6-pack visible, pronounced V-taper | Optimal insulin sensitivity, high VO₂ max | Sustainable with structured training |
| Healthy | Flat waist, faint upper-ab outline | Favorable blood lipids & blood pressure | “Feel good, perform well” sweet spot |
| Average | Soft waistline, minimal ab definition | Borderline-high LDL & fasting glucose | May experience reduced stamina during exertion |
| Obese | Pronounced belly protrusion, love handles | High visceral-fat score, metabolic-syndrome risk | Low energy, joint stress |
†Descriptions adapted from Ultimate Performance visual guide and ACE health categories.

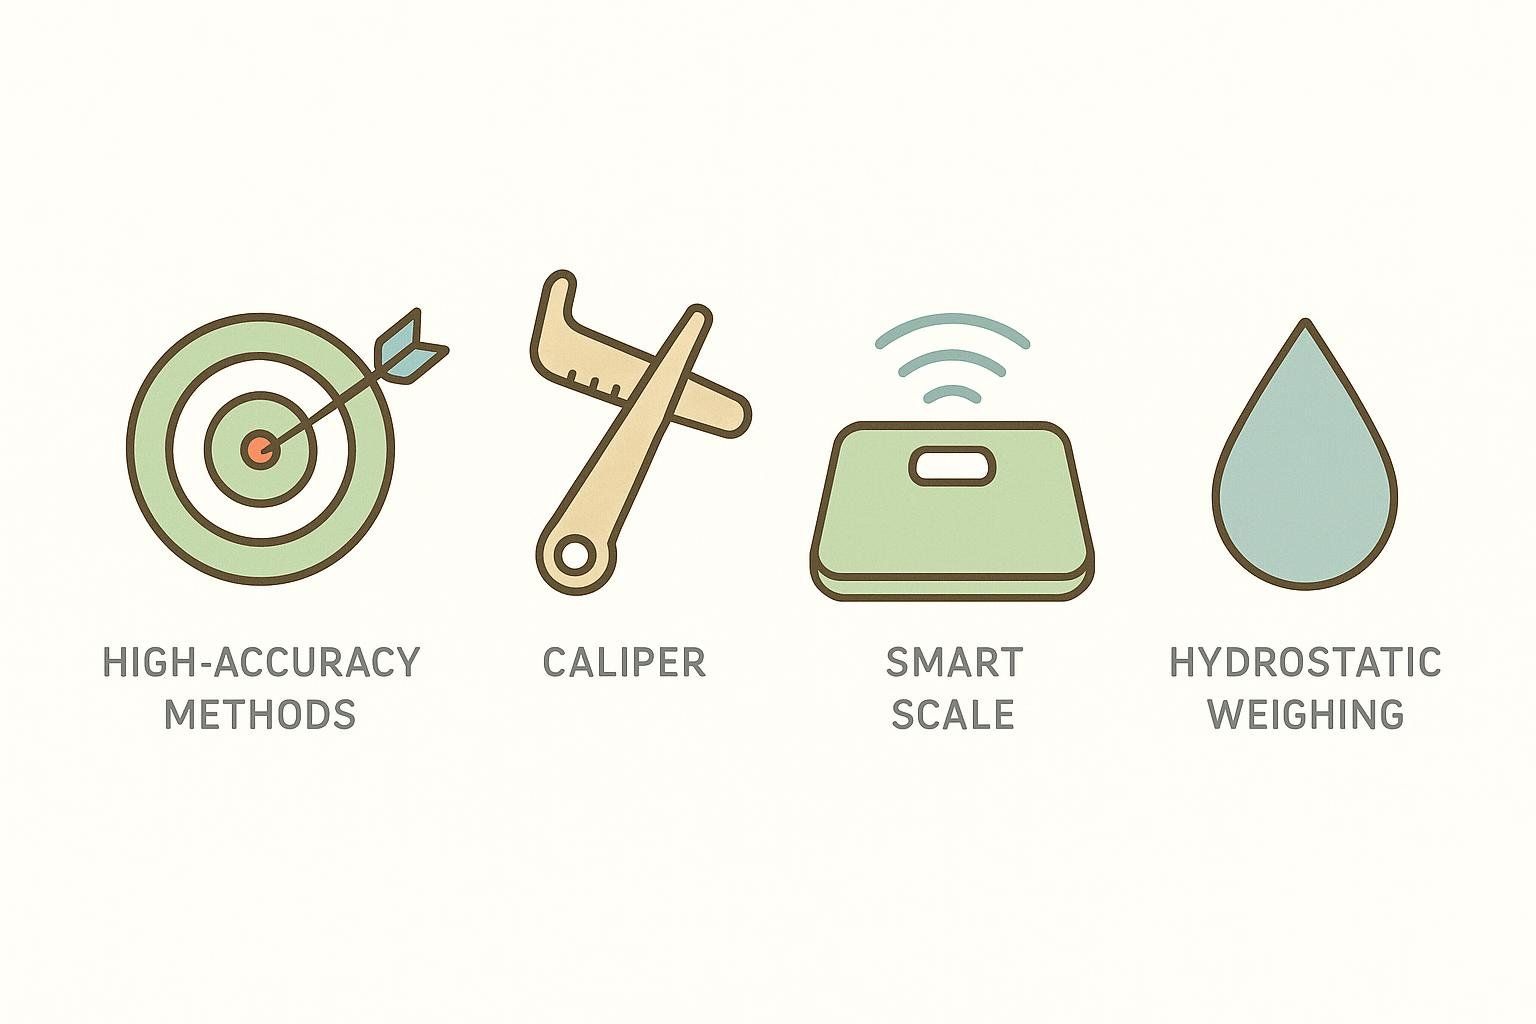
Measuring Body Fat: Accuracy Showdown
| Method | Error (±) | Visceral-Fat Data | Cost | Best For |
|---|---|---|---|---|
| DEXA Scan | 1% | ✔ | $40–$70 | Data-driven training & health management |
| Skinfold Calipers | 3–4% | ✖ | < $40 | Quick gym trend checks |
| Smart-Scale BIA | 4–6% | ✖ | $20–$200 | At-home daily tracking |
| Bod Pod / Hydrostatic | 2–3% | ✖ | $75–$150 | Sports-science labs |
Curious about the pros & cons? See our guide on how to measure body fat accurately.
Health Implications by Category
| Category | Key Risks | Key Opportunities |
|---|---|---|
| Obese | Type 2 diabetes, hypertension, low testosterone | Small calorie deficit + walking yields quick wins |
| Average | Joint stress, creeping visceral-fat gain | Strength training + protein focus re-composes body |
| Healthy | Low chronic-disease risk, high quality of life | Maintain with 3×/week lifting & 8,000–10,000 steps/day |
| Athletic | Requires discipline; risk of under-fueling if mishandled | Fine-tune nutrition for peak performance |
| Essential | Hormonal suppression, injury risk long-term | Transition to a sustainable athletic range post-competition |
With your starting body-fat percentage in hand, use the steps below to shift your metrics one category to the left.
Action Plan: Move One Category Left
- Lift heavy three times per week to preserve lean mass.
- Maintain a 15–20% calorie deficit to lose about one pound per week without sacrificing muscle.
- Eat 0.8–1 gram of protein per pound of your target body weight to support recovery and satiety (International Society of Sports Nutrition).
- Walk 8,000–10,000 steps daily for an easy calorie burn.
- Sleep 7–9 hours and manage stress—high cortisol spikes belly-fat storage.
- Re-scan in 12 weeks and adjust based on fresh data.
For a detailed roadmap, read our guide to diet and workouts for visible abs.
FAQ
What is the ideal body-fat percentage for a man?
Aiming for about 12–18% keeps most men in the chart’s Healthy column—low disease risk, decent muscle definition, and sustainable habits. Younger athletes might target the Athletic range (6–12%), while men over 50 can still see excellent health markers at the upper end of Healthy (up to ~19%).
What does 15% body fat look like on a man?
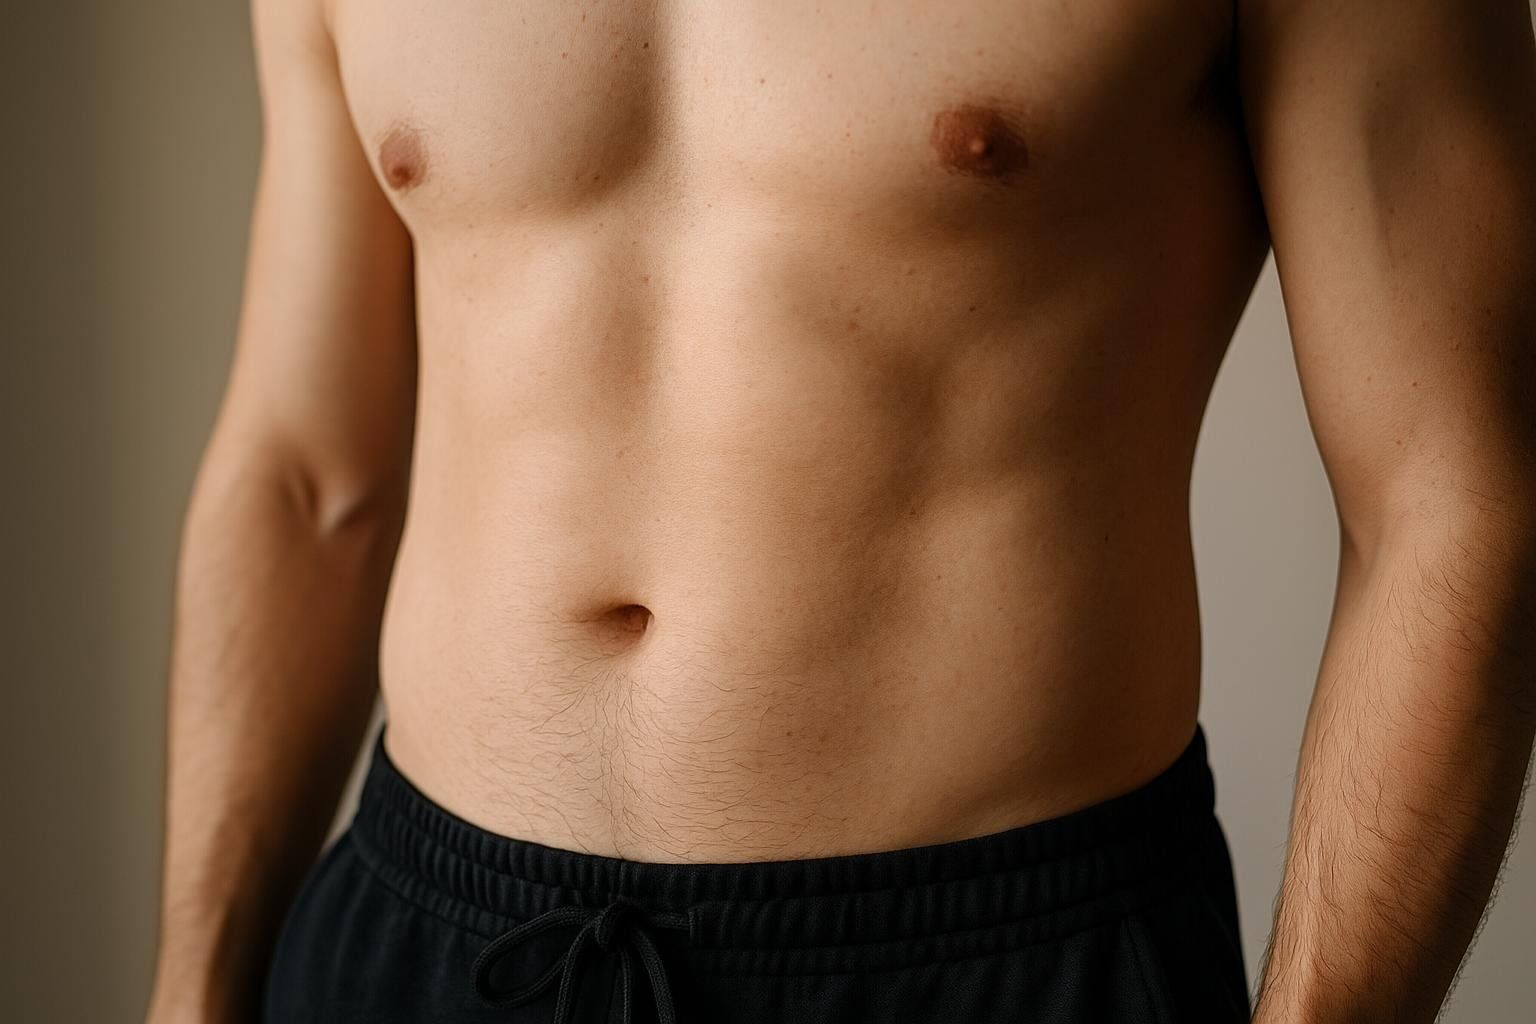
Expect a flat waist, faint upper-ab lines, some vascularity in arms, and clear muscle separation in shoulders and thighs. Clothes fit comfortably without the “skin-tight” squeeze, and energy levels stay high with moderate calorie intake.
Is 20% body fat considered overweight for a man?
Twenty percent sits at the high end of Average. You may lose most ab definition and notice a softer waistline, but it is not classified as obese. Health markers can still be acceptable, though pushing toward the Healthy range (≤16–18% for most ages) typically improves blood pressure and insulin sensitivity.
Why is my BMI so high but I’m not fat?
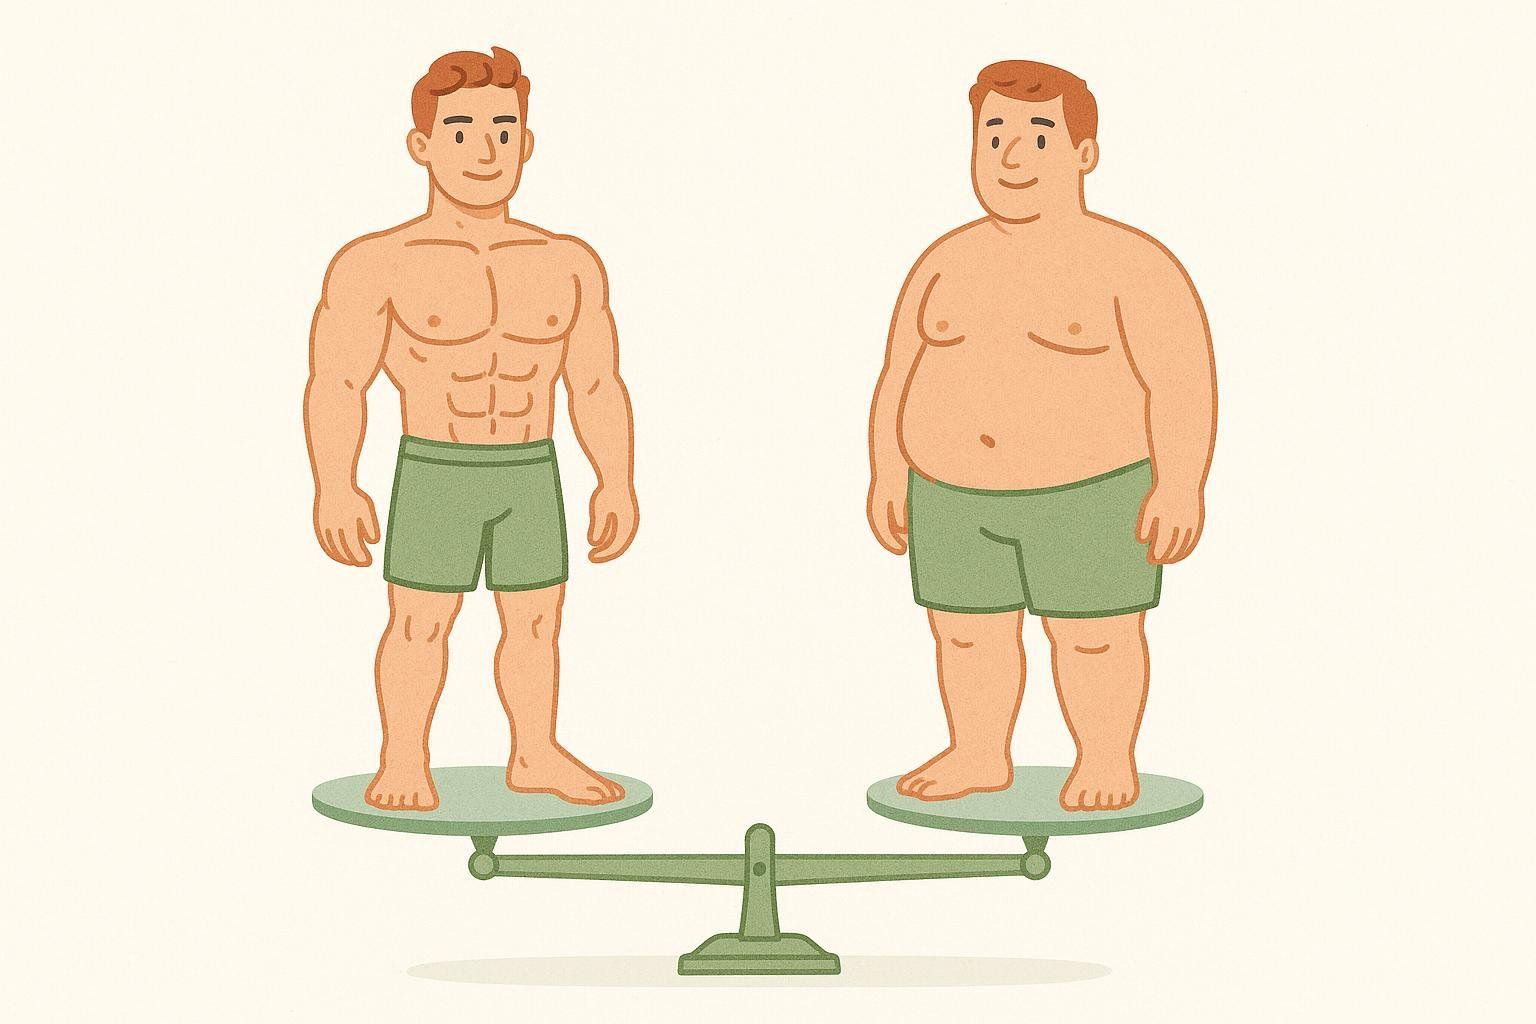
BMI can misclassify lean, muscular men because it does not separate weight from composition. Muscle is denser than fat, so someone with significant muscle mass can register an “overweight” or even “obese” BMI while sitting at 10–15% body-fat. A DEXA scan reveals the true fat-to-lean breakdown, making it the gold-standard confirmation.
Can I see abs at 15% body-fat?
Many men start seeing a top-row outline around 15%, especially with solid abdominal muscle. Full six-packs usually appear ≤12%. Learn more about the body-fat percentage for visible abs.
How often should I measure?
Tape or smart scale weekly; DEXA every 3–4 months for high-precision feedback.
Does age change how quickly I can lose fat?
Yes—testosterone decline and sarcopenia slow metabolism, but consistent strength training and protein mitigate the drop.
Ready to Know Your Number?
Stop guessing. Find a BodySpec location near you to precisely track your progress.
