BMI vs Body Fat Percentage: Which Reflects Your Health Better?
BMI vs Body Fat Percentage: Which Number Actually Reflects Your Health?
For decades, Body Mass Index (BMI) has been the go-to shorthand for labeling people as underweight, normal weight, or obese.
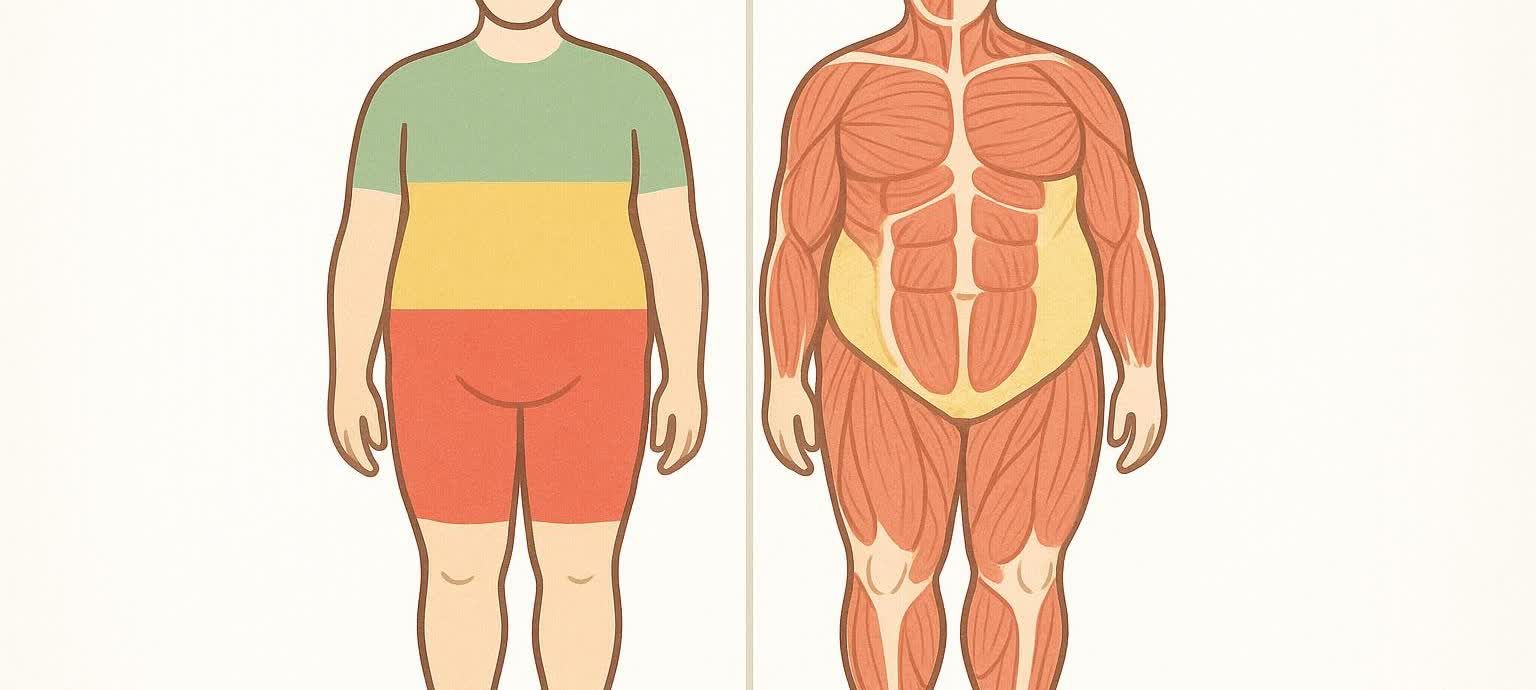
Yet its one-size-fits-all math often clashes with real bodies. A muscular athlete might be called “overweight,” while a slender office worker could carry more hidden fat than the chart suggests. Is BMI really telling the whole story?
The short answer is no—at least not for individuals. In 2023 the American Medical Association issued a policy statement noting BMI’s “significant limitations.” The AMA now advises clinicians to pair BMI with direct measures such as waist circumference, measurements of visceral fat, or body composition assessments AMA press release on BMI’s limitations.
This guide compares each metric's strengths and blind spots and provides a practical plan for tracking the number that matters most to your goals.
BMI vs. Body Fat: What Do These Metrics Measure?
| Metric | How it’s calculated | What it estimates | Key limitation |
|---|---|---|---|
| BMI | Weight (kg) ÷ height² (m²) | Total body mass relative to height | Cannot distinguish fat from muscle or bone; loses predictability at the individual level |
| Body-fat % | Proportion of total weight that is fat (measured by tools like DEXA, BIA, calipers) | Actual adipose tissue on your body | Accuracy depends on measurement method |
Why It Matters
-
Health risk comes from where weight is stored, not weight alone.
- Too much visceral fat—fat wrapped around organs—is closely tied to metabolic disease. Learn more about healthy visceral-fat levels.
- The CDC outlines obesity consequences ranging from heart disease to diabetes.
-
Muscle is denser than fat. Two people with identical BMIs can have very different physiques—and health profiles.

BMI vs Body-Fat: Pros & Cons Side-by-Side
| BMI | Body-Fat Percentage | |
|---|---|---|
| Speed & Cost | Free; requires only a scale & stadiometer | Costs range from DIY options like calipers (~$20) to a BodySpec DEXA scan (typically $40–$60 per scan) |
| Ease of Use | One simple formula | Requires a device or appointment |
| Population Research | Extensive epidemiological data | Expanding clinical research base |
| Individual Accuracy | Low—frequent misclassification in athletic, older-adult, and ethnically diverse groups | High with DEXA; moderate with calipers/BIA |
| Tracks Change Over Time | Poor—muscle gain skews results | Excellent—shows fat vs. lean progress |
BMI is useful for large-scale screening but is unreliable for personal decisions. Body-fat percentage provides actionable, individualized insight.
How Each Metric Is Measured
1. BMI: The 30-Second Calculation
- Weigh yourself in kilograms.
- Measure height in meters.
- Divide weight by height squared.
BMI Categories (Adults):
| Category | BMI (kg/m²) |
|---|---|
| Underweight | < 18.5 |
| Normal | 18.5 – 24.9 |
| Overweight | 25 – 29.9 |
| Obesity I | 30 – 34.9 |
| Obesity II | 35 – 39.9 |
| Obesity III | ≥ 40 |
Important: These cut-offs don’t adjust for sex, age, or ethnicity—even though body-fat distribution often does National Academies report on body composition. The AMA recommends combining BMI with direct adiposity measures for any clinical assessment.
For a deeper dive, see Why BMI Calculators Aren’t Useful.
2. Body-Fat Percentage: Four Common Tools
| Method | Typical Error (±) | Pros | Cons |
|---|---|---|---|
| Skinfold Calipers | 3.5–5% | Low cost, portable | Requires practitioner skill; less reliable at very high or very low body-fat levels |
| Bioelectrical Impedance (BIA) | 3.8–5% | Widely available smart scales | Hydration & meal timing can shift readings |
| Hydrostatic Weighing / Bod Pod | 2–3% | Well-researched | Requires swimsuit, full-body submersion, forceful exhalation; uncomfortable and inconvenient |
| DEXA Scan | ~1% | Gold standard for fat, lean, bone, and visceral-fat data—see What Is a DEXA Scan? | Small amount of low-dose X-ray (generally contraindicated during pregnancy); appointment required |
Typical error ranges are backed by peer-reviewed research:
- An Institute of Medicine review on measurement error found 3–9% error for anthropometric methods and 2–3% for densitometry.
- A multi-frequency BIA validation study reported roughly 3–5% limits of agreement in healthy adults.
- iDXA precision research shows about a 1% coefficient of variation for total-body fat mass.
Healthy Ranges: BMI vs. Body-Fat %
| Sex | Age Group | Healthy Body-Fat % | BMI “Normal” Range |
|---|---|---|---|
| Men | 20–39 | 8–19% | 18.5–24.9 |
| Men | 40–59 | 11–21% | 18.5–24.9 |
| Women | 20–39 | 21–32% | 18.5–24.9 |
| Women | 40–59 | 23–33% | 18.5–24.9 |
Sources: ACE body-fat chart (body-fat) and WHO factsheet on obesity (BMI).
You can sit comfortably in the “normal” BMI window yet exceed healthy body-fat percentages. This condition—often called normal-weight obesity—is linked to insulin resistance and heart disease. Learn more in our guide to Skinny Fat Body Type: Identifying and Understanding Your Physique.
Special Populations & Misclassifications
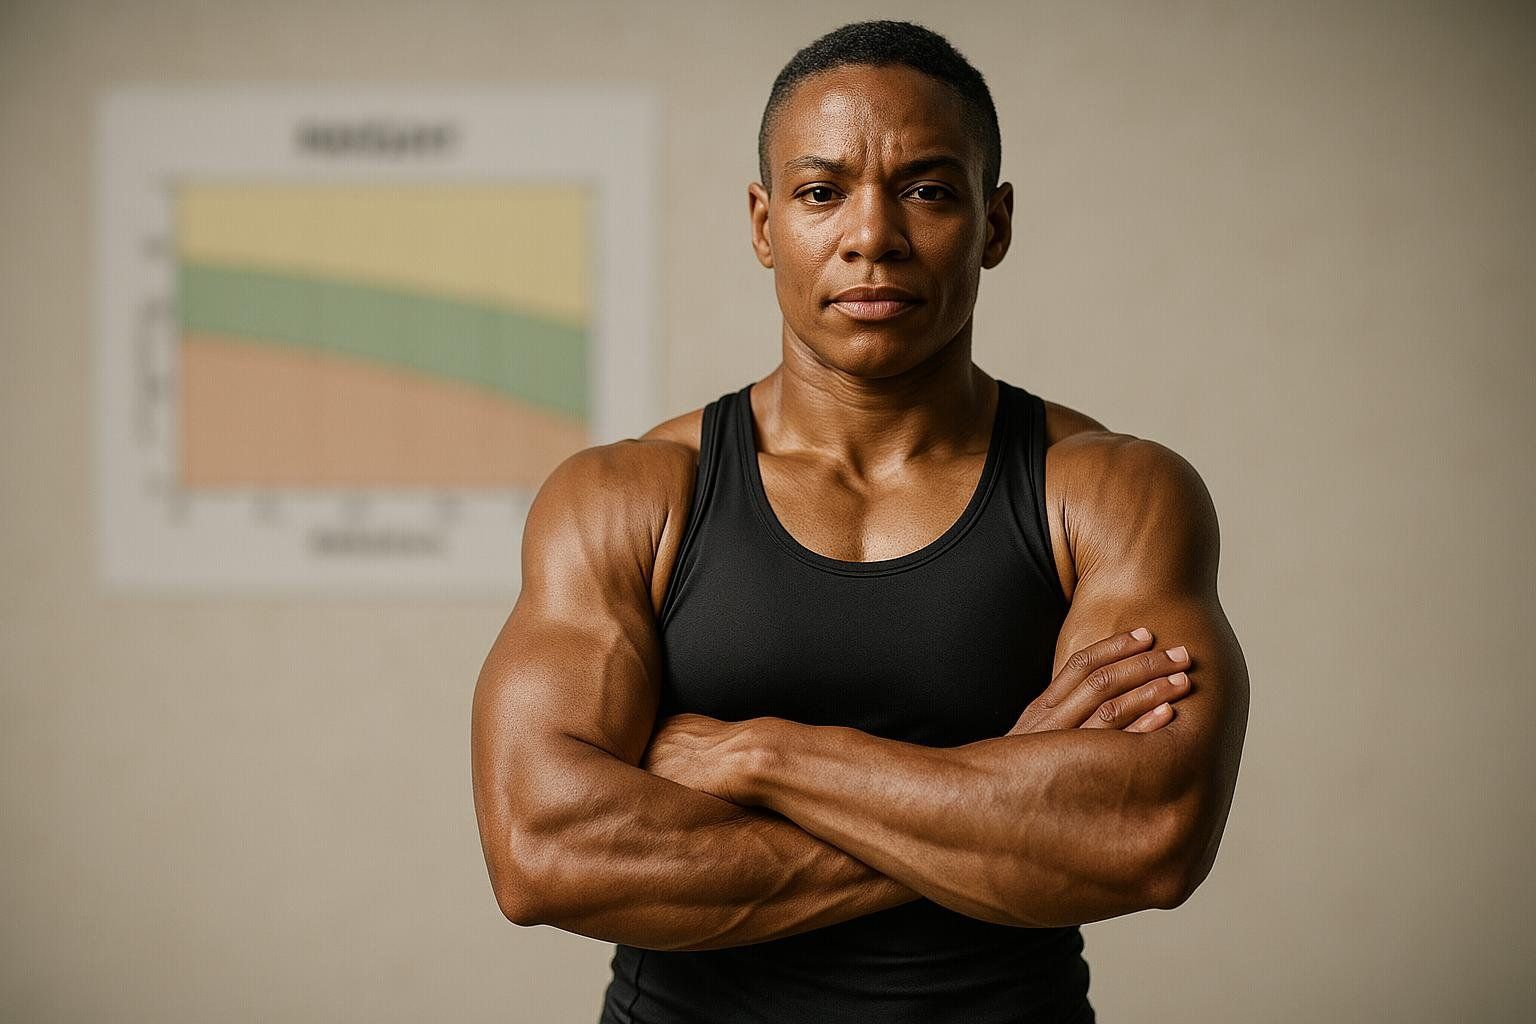
- Athletes & Lifters – Among 33,896 adolescent athletes, BMI classified 13% as obese, but skinfolds confirmed only 6%.
- Boys: 54% of BMI “obesity” classifications were false positives.
- Girls: 71% were false positives Sports Health study.
- Older Adults – Muscle loss can cloak high fat levels behind a “healthy” BMI. Body-fat scans detect sarcopenic obesity earlier, a topic further explored in our guide on appendicular lean mass and sarcopenia.
- Different Ethnicities – South Asians develop metabolic issues at lower BMIs, while Polynesian populations may tolerate higher BMIs due to greater lean mass National Academies findings on ethnicity and body composition.
- Pregnancy – BMI naturally rises due to the baby, placenta, and fluid changes. Direct body-fat measurement tools like DEXA scans are generally contraindicated during pregnancy. Instead, focus on appropriate gestational weight gain, guided by the CDC pregnancy weight guidelines.
Choosing the Right Metric for You
| Goal | Recommended Metric(s) | Rationale |
|---|---|---|
| Public-health surveillance | BMI | Cheap, quick estimate for large populations |
| Personal fat-loss or muscle-gain plan | Body-fat % (ideally DEXA) | Separates fat from muscle changes |
| Athletic performance | Body-fat % + lean mass | Relates to power-to-weight ratio |
| Cardiometabolic risk management | Body-fat % + visceral-fat score + waist circumference | Directly tied to insulin resistance |
Action Plan: Track What Matters
- Book a baseline scan to learn what a DEXA scan is and how it can help. A single appointment takes about ten minutes, uses a low-dose X-ray, and delivers comprehensive data on fat, muscle, and bone.
- Set SMART targets (Specific, Measurable, Achievable, Relevant, Time-bound). Example: “Drop body-fat from 28% to 24% in four months while keeping lean mass steady.”
- Measure every 8–12 weeks. Long enough for real change, short enough to tweak strategy.
- Use waist circumference for weekly check-ins. Cheap, fast, and strongly linked to visceral fat.
- Re-scan to confirm progress. Data beats guesswork.
Need a scan? Check DEXA Scan Near Me to locate a mobile clinic in your area.
FAQs
Is BMI ever useful?
Mainly for public-health statistics or when no other tools are available. Even then, the AMA recommends pairing BMI with direct measures of body fat such as waist circumference or body-composition scans AMA guidance on BMI use.
How low should my body-fat percentage be?
Essential fat is the minimal amount of fat required for normal physiological function—think cell membranes, hormone production, and cushioning for organs. It ranges from about 2–5% in men and 10–13% in women ACE guidelines on essential fat percentages. For most health and fitness goals, staying within the healthy ranges listed above is sufficient.
Can smart scales replace DEXA?
Home BIA scales help spot trends but can swing several points with hydration. Use them between periodic DEXA scans.
What about waist circumference?
A tape measure is powerful. Aim for < 40 in (102 cm) in men and < 35 in (88 cm) in women NHLBI waist-circumference guidelines.
Key Takeaways
- BMI is a blunt tool best suited for population studies—not personal health decisions.
- Medical organizations now urge health professionals to pair BMI with direct measures like waist size and body-fat scans for a fuller picture.
- Emerging research supports redefining obesity by body-fat %, moving beyond BMI study on redefining obesity by body-fat %.
- DEXA-measured body-fat offers ±1% error—today’s most precise option.
- Choose the metric that fits your goal, and measure it consistently.
Ready to ditch one-size-fits-all numbers? BodySpec’s low-dose DEXA scans put clear, precise data in your hands—so every workout, meal, and habit targets the metrics that reflect your actual health progress.
