Women’s Body Fat Percentage Chart by Age: How to Measure and Use Your Numbers

Women’s Body Fat Percentage Chart by Age: How to Measure, Interpret, and Use Your Numbers
TL;DR – Healthy Ranges in One Minute
• For most women, a healthy body-fat window sits between 20 – 33 percent depending on age and activity level.
• Athletes often fall in the 15 – 22 percent zone, while essential fat (the minimum for hormonal health) bottoms out around 10 – 14 percent.
• A reading of 25 percent is squarely in the Fitness category for women in their 30s and 40s, according to the chart below.
• A 27 percent measurement typically places you in the Average category if you’re under 50, with metabolic risk still considered low by most clinical standards.
• Scroll to the decade-specific chart below for health-focused targets at every age.
Body-fat percentage is far more revealing than a scale weight or BMI. Yet a quick Google search can leave you swimming in conflicting charts and photos that don’t reflect your age or life stage. This guide cuts through the noise with an evidence-based body-fat percentage chart for women, clear measurement instructions, and age-specific advice—from your 20s through menopause and beyond.
Quick-Look Body-Fat Percentage Chart for Women
| Age | Essential Fat | Athletes | Fitness | Average | High |
|---|---|---|---|---|---|
| 20 – 29 | 10 – 14 % | 15 – 19 % | 20 – 24 % | 25 – 30 % | >30 % |
| 30 – 39 | 11 – 15 % | 16 – 20 % | 21 – 25 % | 26 – 31 % | >31 % |
| 40 – 49 | 12 – 16 % | 17 – 21 % | 22 – 26 % | 27 – 32 % | >32 % |
| 50 – 59 | 13 – 17 % | 18 – 22 % | 23 – 27 % | 28 – 33 % | >33 % |
| 60 + | 14 – 18 % | 19 – 23 % | 24 – 28 % | 29 – 34 % | >34 % |
How we built this chart
Ranges blend categories from the American Council on Exercise with whole-body data drawn from the 2022 National Health and Nutrition Examination Survey (NHANES). We then added approximately + 1 percentage-point per decade based on findings from a longitudinal study on age-related fat gain showing women accrue 1–2 percent additional body fat every 10 years.
Why Body-Fat Percentage Beats BMI—Especially for Women
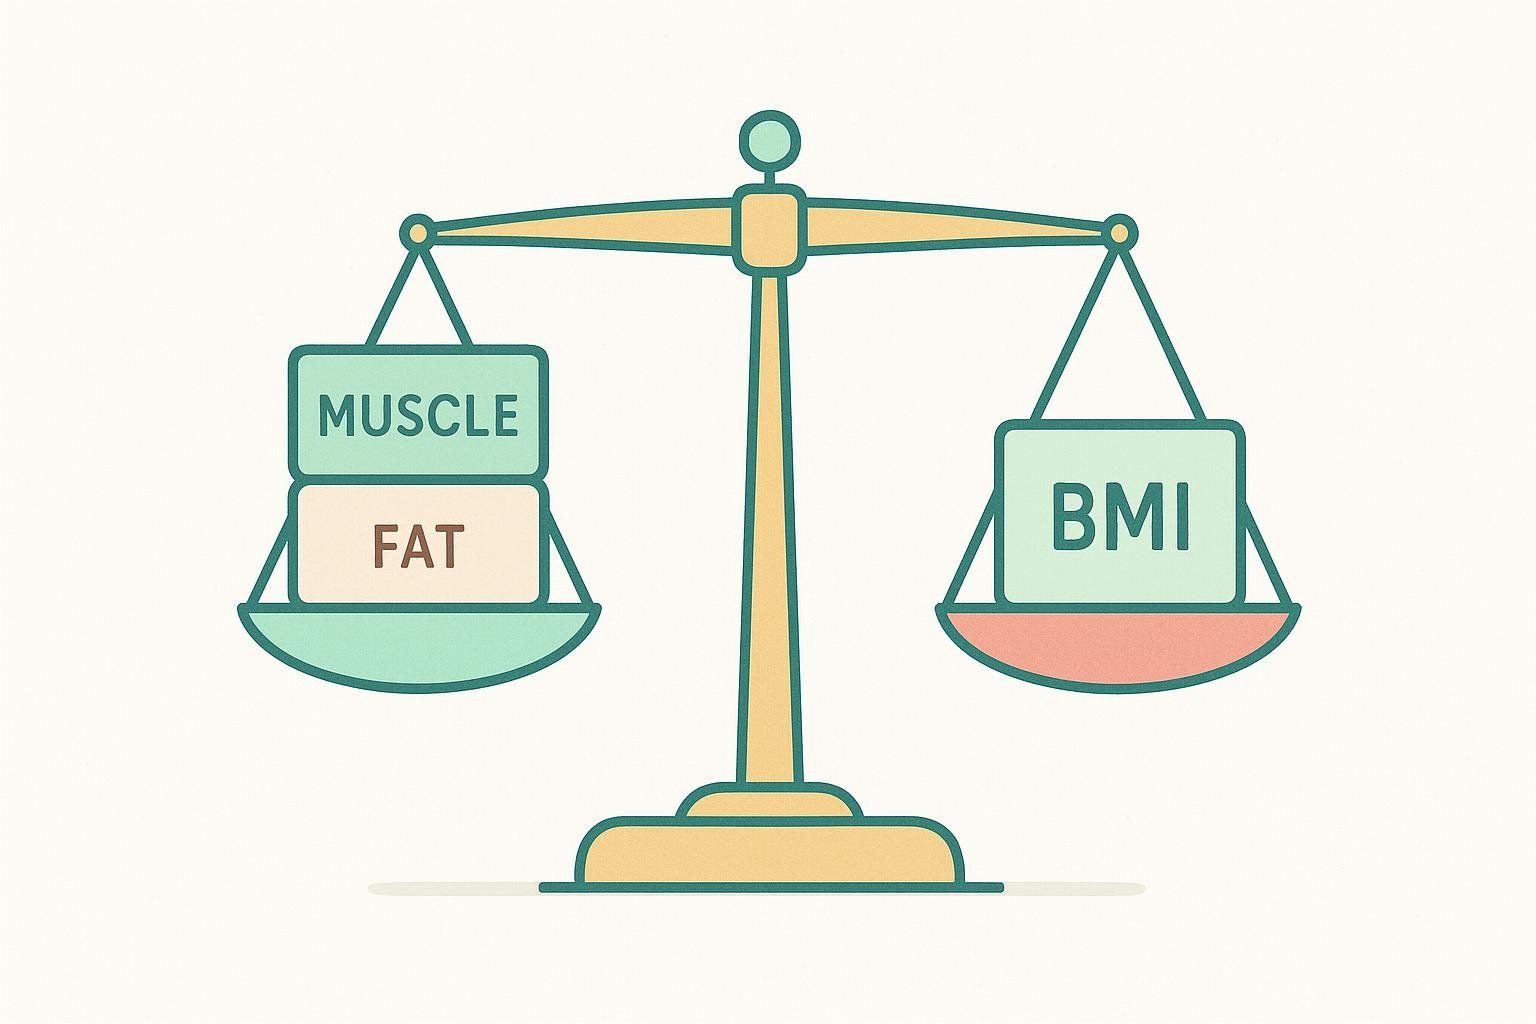
BMI can call a lean, muscular CrossFitter “overweight” and label a sedentary woman with low muscle mass “healthy.” Body-fat percentage looks directly at what matters—your ratio of fat to lean tissue. Higher percentages correlate with insulin resistance, cardiovascular risk, and sarcopenia, even when BMI appears normal (Baylor College of Medicine article on body-fat vs. BMI).
The Three Most Accurate Ways to Measure Body Fat
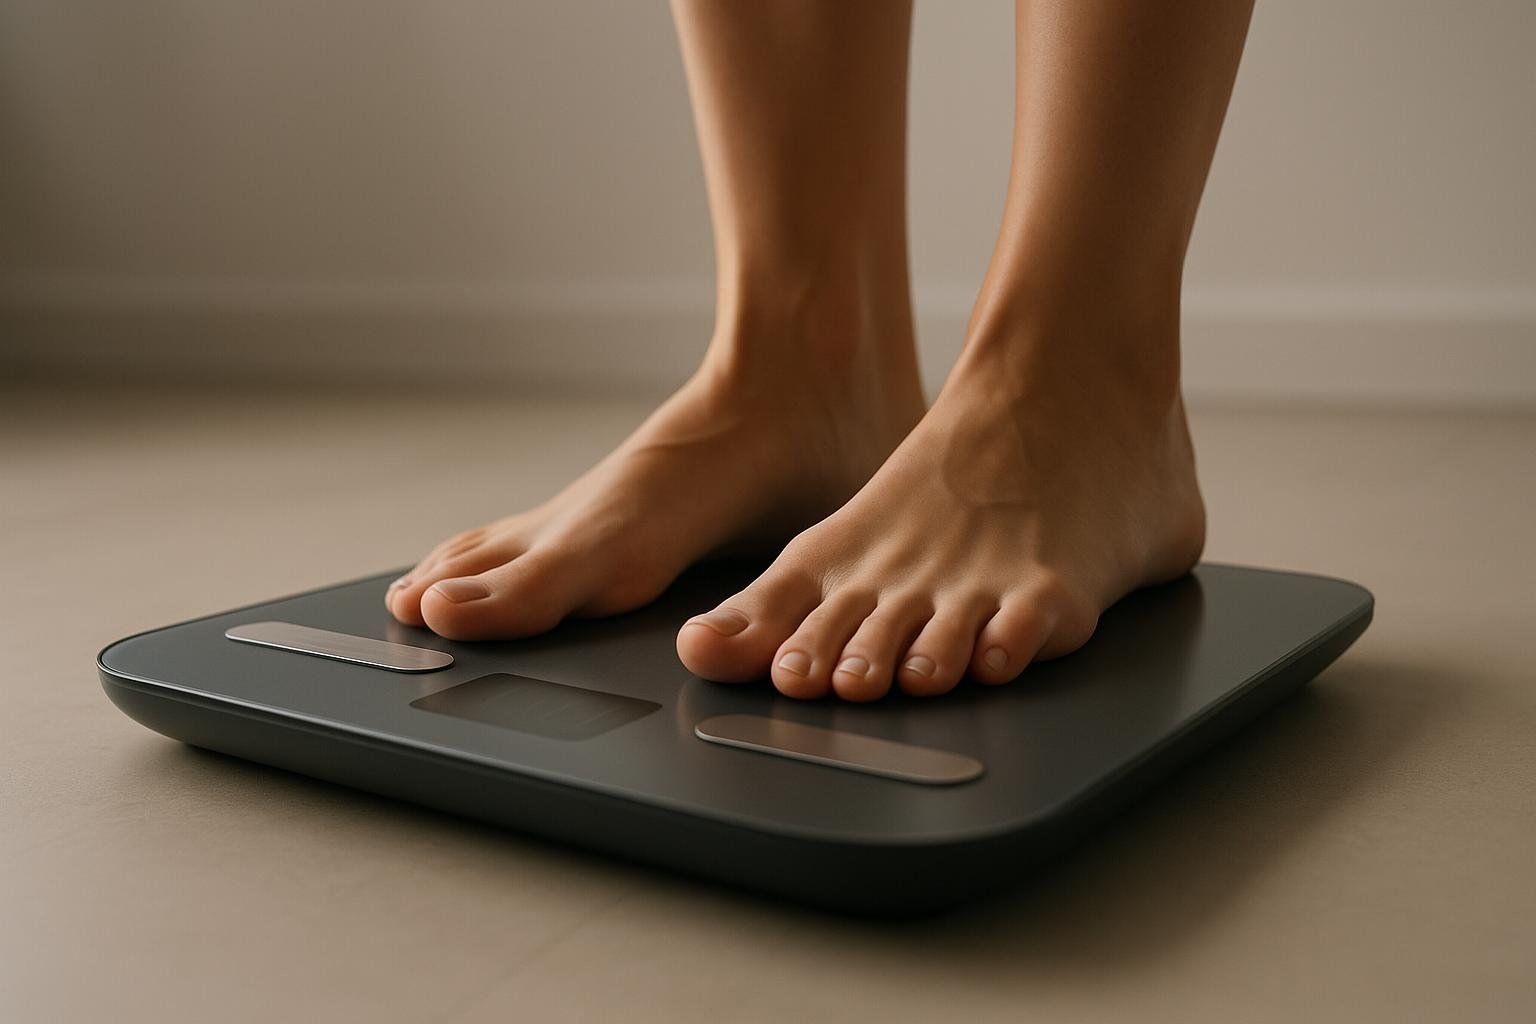
- DEXA Scan (Gold Standard) – Emits low-dose X-rays to quantify fat, lean, bone, and visceral fat. Margin of error: ± 1 – 2 %.
- Bioelectrical Impedance Analysis (BIA) smart scales (e.g., InBody) – Convenient but sensitive to hydration. Expect ± 3 – 5 % error.
- Skinfold Calipers – Budget-friendly if you master technique. Error shrinks to ± 3 % with consistent pinch sites.
For more detail—including images—see How to Measure Body Fat: A Step-by-Step Guide.
Step-by-Step: Preparing for a DEXA Scan
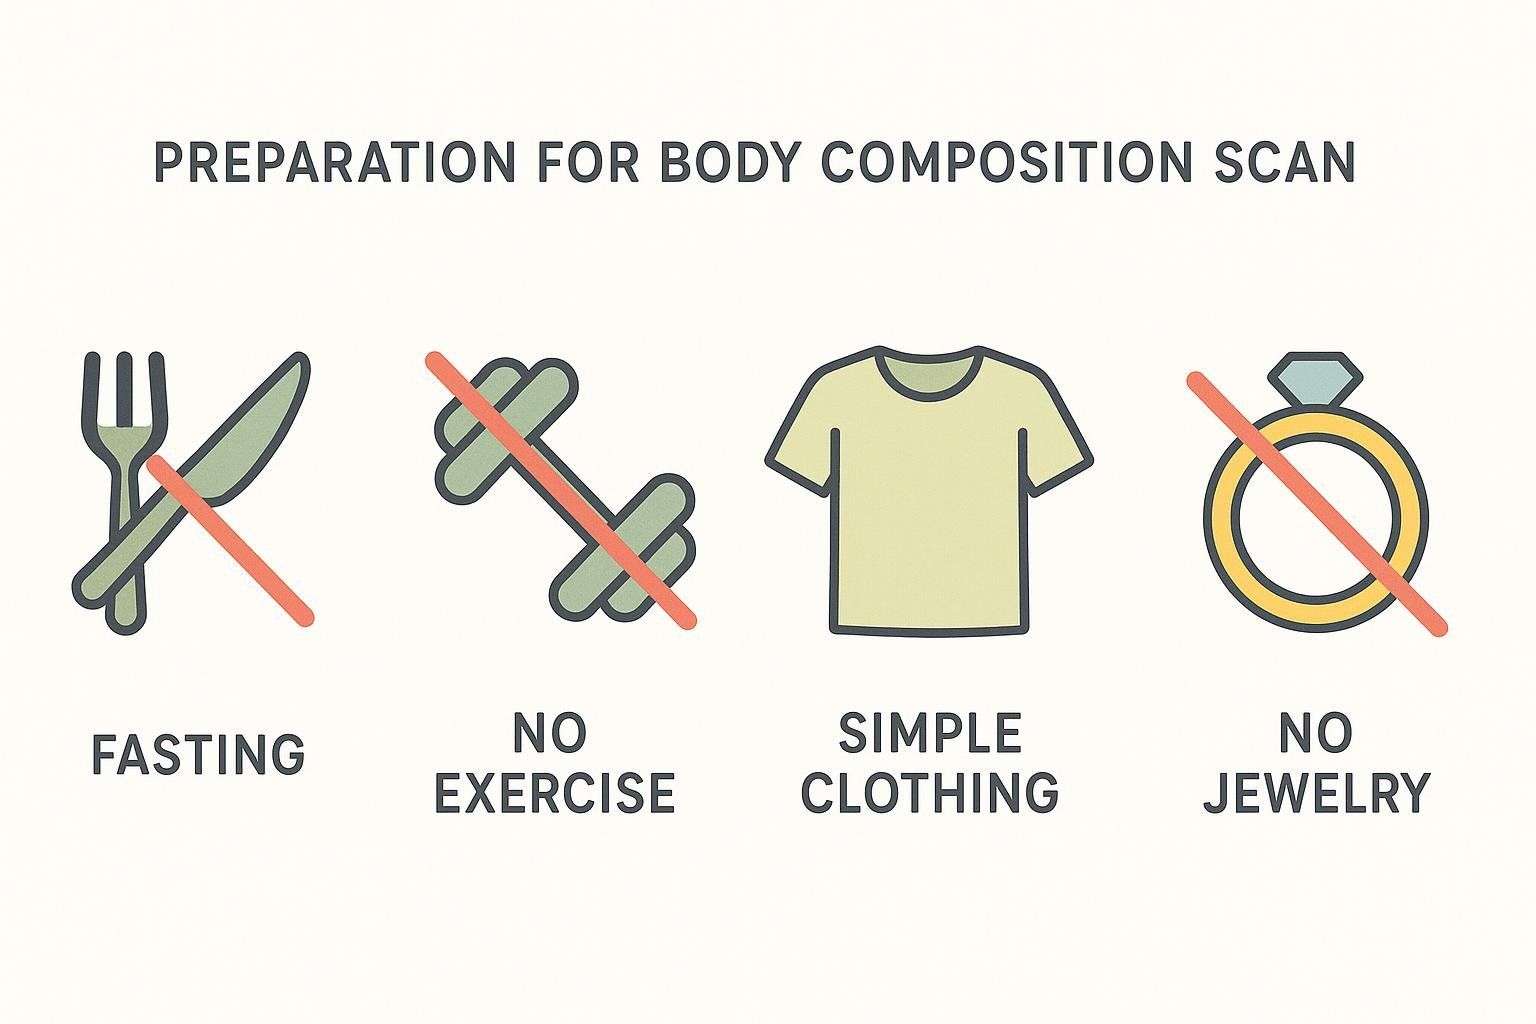
- Fast 3 – 4 hours. Food and fluid alter tissue hydration and can skew results.
- Skip heavy training and saunas for 12 hours. Intense exercise shifts fluid into muscle.
- Wear light, metal-free clothing. Zippers and buttons create artifacts.
- Remove jewelry & smart watches. Even tiny metals matter.
For additional pointers, read 5 Tips for a Successful BodySpec Scan.
Age-Specific Guidance
In Your 20s – Early 30s: Building the Base
• Metabolic Advantage: Resting metabolic rate peaks, making it easier to stay in the Fitness zone—20 – 24 % for your 20s and 21 – 25 % for your early 30s.
• Goal Tip: Prioritize lean-mass gains; muscle built now protects against future age-related fat accumulation.
• Tracking: Regular body-composition scans (e.g., every 2 – 4 months) help quantify muscle and fat shifts accurately.
In Your 30s: Juggling Careers, Kids, and Composition
• Lifestyle Reality: Sleep debt and stress can raise cortisol and promote abdominal fat.
• Target Range: Fitness or lower Average band (21 – 28 %).
• Actionable Move: Schedule two strength workouts each week and aim for approximately 0.4 g of protein per kilogram per meal—about 25 g for a 65-kg woman—to maximize muscle protein synthesis (see consensus paper on protein timing).
In Your 40s and 50s: Guarding Muscle as Hormones Shift
Estrogen decline redistributes fat toward the abdomen. A meta-analysis on lean-mass loss estimates inactive women lose 3 – 8 % lean mass per decade starting in their 30s.
• Targets:
• 40s – Average 27 – 32 % (or lower)
• 50s – Average 28 – 33 % (or lower)
• Action Steps: Compound lifting 2 – 3 days/week (ACSM evidence-based guidelines), 7 – 10 k daily steps, and total protein ≥ 1.6 g/kg body weight (see this systematic review on protein intake).
Postpartum: Healing & Recomposition
Pregnancy adds strategic fat stores around the hips and abdomen. Only 30 % of women returned to pre-pregnancy weight by 12 months in a 2021 postpartum cohort. Because weight retention is largely fat—particularly in the trunk area—many women find body-fat percentage elevated for a year or more.
• Goal Range: Progress toward the Fitness or Average band for your age.
• Strategy: Combine gentle strength work with pelvic-floor rehab before ramping up intensity.
• Learn more: Postpartum Body Recomposition.
55 + (Menopause & Beyond): Protecting Healthspan
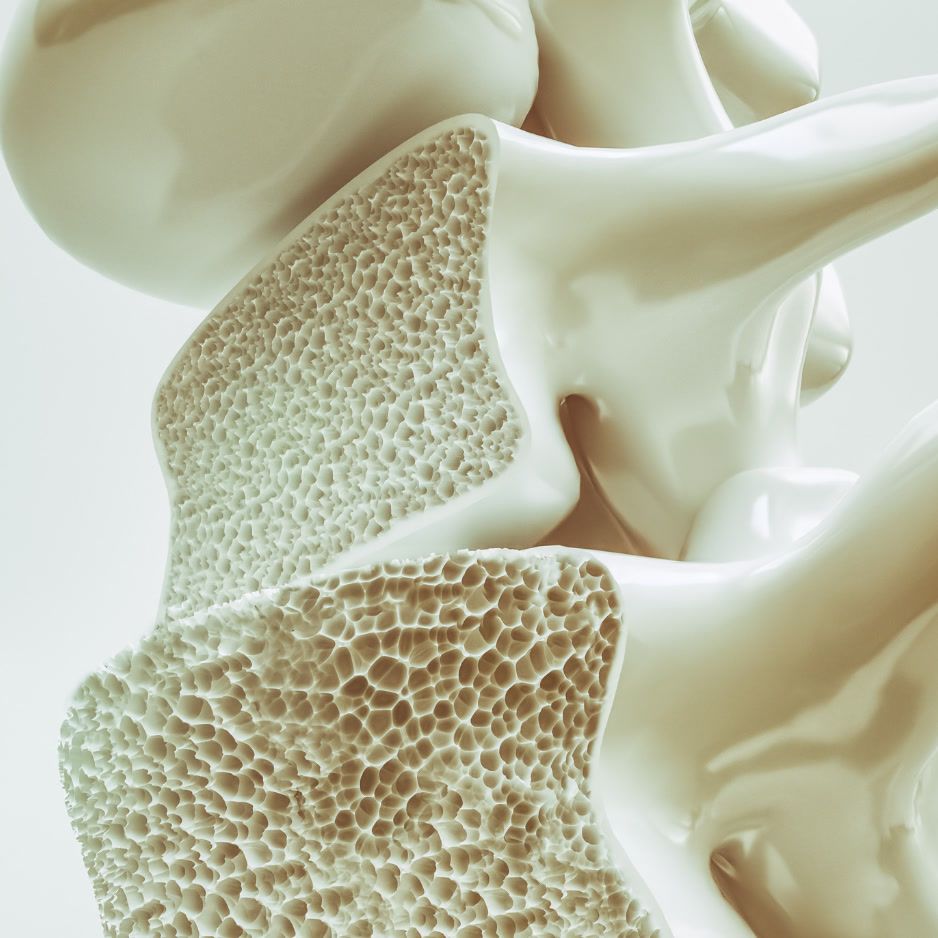
Higher body fat now links strongly with frailty and type 2 diabetes. Yet being too low (< 18 %) may impair bone mineral density, according to a 2018 study on fat and bone health.

• Optimal Zone: Fitness 23 – 27 % for the late 50s and 24 – 28 % for 60 +.
• Bone Check: Pair each body-composition scan with a DEXA bone-density test every two years. Medicare may cover these scans under certain conditions; confirm eligibility with your provider.
Frequently Asked Questions
What percent body fat should a female be?
Most professional guidelines put women in the 20 – 33 percent range for good health. The lower end (20 – 24 %) lines up with the Fitness category; the upper end (28 – 33 %) sits in Average but is still metabolically acceptable for many ages.
Is 25 % body fat OK for a woman?
Yes. Twenty-five percent is in the Fitness band for women in their 20s – 30s and in lower Average for older decades. A cross-sectional study linking body-fat percentage to cardiometabolic risk showed risk rises sharply once women exceed about 35 % body fat.
What is the ideal body fat for each age?
Healthy ranges climb roughly 1 – 2 percentage points per decade. Example: Fitness is 20 – 24 % in your 20s but 23 – 27 % by your 50s. See the full chart above for exact numbers.
What does 27 % body fat look like for a woman?
At around 27 percent, many women show mild muscle definition in limbs, a soft (not protruding) midsection, and clear waist-to-hip curves. Appearance varies by genetics, muscle mass, and fat distribution.
What is a dangerous body fat percentage for women?
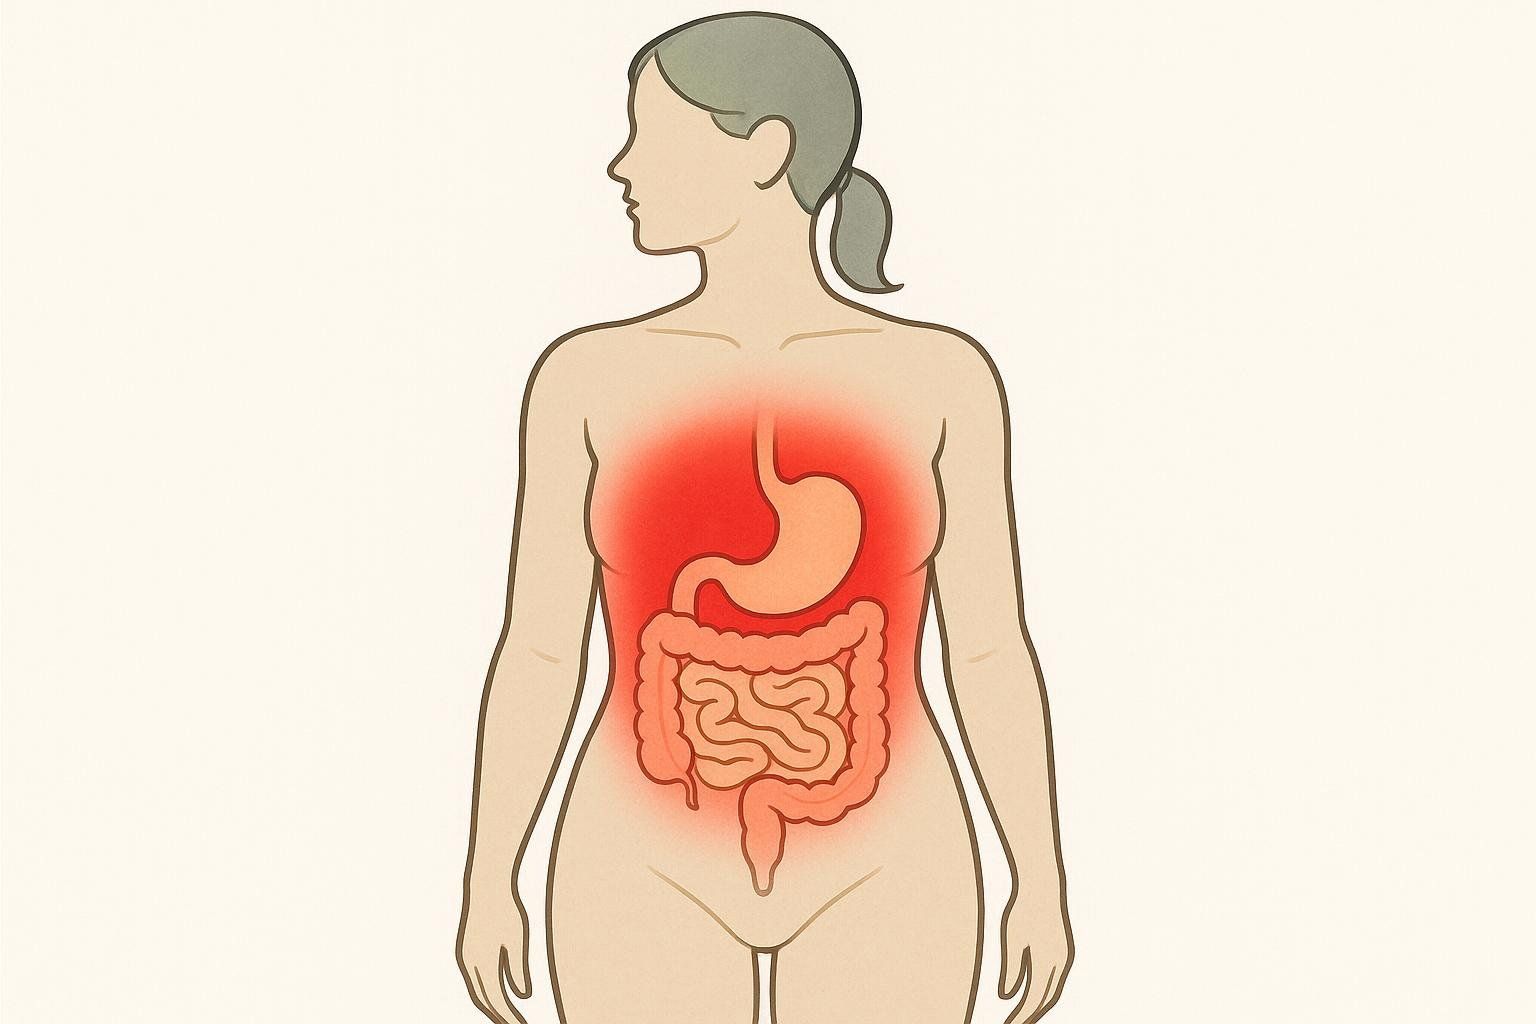
Percentages in the High column of the chart (> 30 – 34 %, depending on age) are tied to elevated disease risk. High visceral fat—often flagged by a waist circumference above 35 in (88 cm)—further magnifies cardiometabolic danger, even when total body fat is moderate, per an American Heart Association scientific statement.
Can I spot-reduce hip or belly fat?
No. Fat loss is systemic. Strength work shapes underlying muscle; a calorie deficit mobilizes stored fat.
How often should I re-test body fat?
Every 2 – 3 months during active change phases; once a year for maintenance.
Does menopause require a different chart?
No. The main chart already accounts for age-related changes. For women 55 +, the Fitness range for their band (23 – 28 %) remains an excellent health target.
Take the Next Step
Ready for the most precise reading? Find a BodySpec DEXA truck near you and book in under 60 seconds.
Disclaimer: BodySpec provides wellness information, not medical diagnosis. Always consult your healthcare provider for personalized advice.
