2025 Body Fat Percentage Insights by Zip Code

Lowest & Highest Body Fat Percentage Zip Codes in Austin, Dallas–Fort Worth, Seattle & Northern and Southern California
How much can a simple five-digit number tell you about your typical body-fat levels? Potentially quite a bit. Early analyses suggest that where you live influences your access to parks, healthy food, and health care—all of which shape the average body fat levels of local residents (Health Leads).
In partnership with anonymized, aggregated DEXA-scan data from BodySpec clients and public datasets from the CDC and USDA, we reveal which zip codes have the lowest and highest average body-fat percentages across five major metros:
- Austin, TX
- Dallas–Fort Worth, TX
- Seattle, WA
- Northern California (Bay Area + Sacramento)
- Southern California (Los Angeles, Orange County & Inland Empire)
Methodology at a Glance
| Metric | Weight | Why It Matters |
|---|---|---|
| DEXA-Derived Body-Fat % (BodySpec anonymized 2023–2024 scans) | 50 % | Gold-standard measure of body-fat levels |
| Obesity Prevalence (CDC PLACES 2024) | 20 % | Validates trends in areas with fewer scans |
| Walkability (Walk Score 2025) | 10 % | Higher scores correlate with lower BMI & body fat |
| Park & Trail Access (Trust for Public Land ParkServe 2024) | 10 % | Nearby green space promotes physical activity |
| Healthy-Food Access (USDA Food Access Atlas 2024) | 10 % | Produce-rich grocers improve diet quality |
Lowest & Highest Body Fat Percentage Zip Codes
Why These Gaps Exist
- Age Distribution & Household Structure
CDC small-area estimates show that zips with a younger median age (< 35) report 5–7-point lower obesity prevalence. Younger populations also make up a larger share of BodySpec’s scan base, amplifying their influence on our PZBFI.
2. Walkability & Built Environment
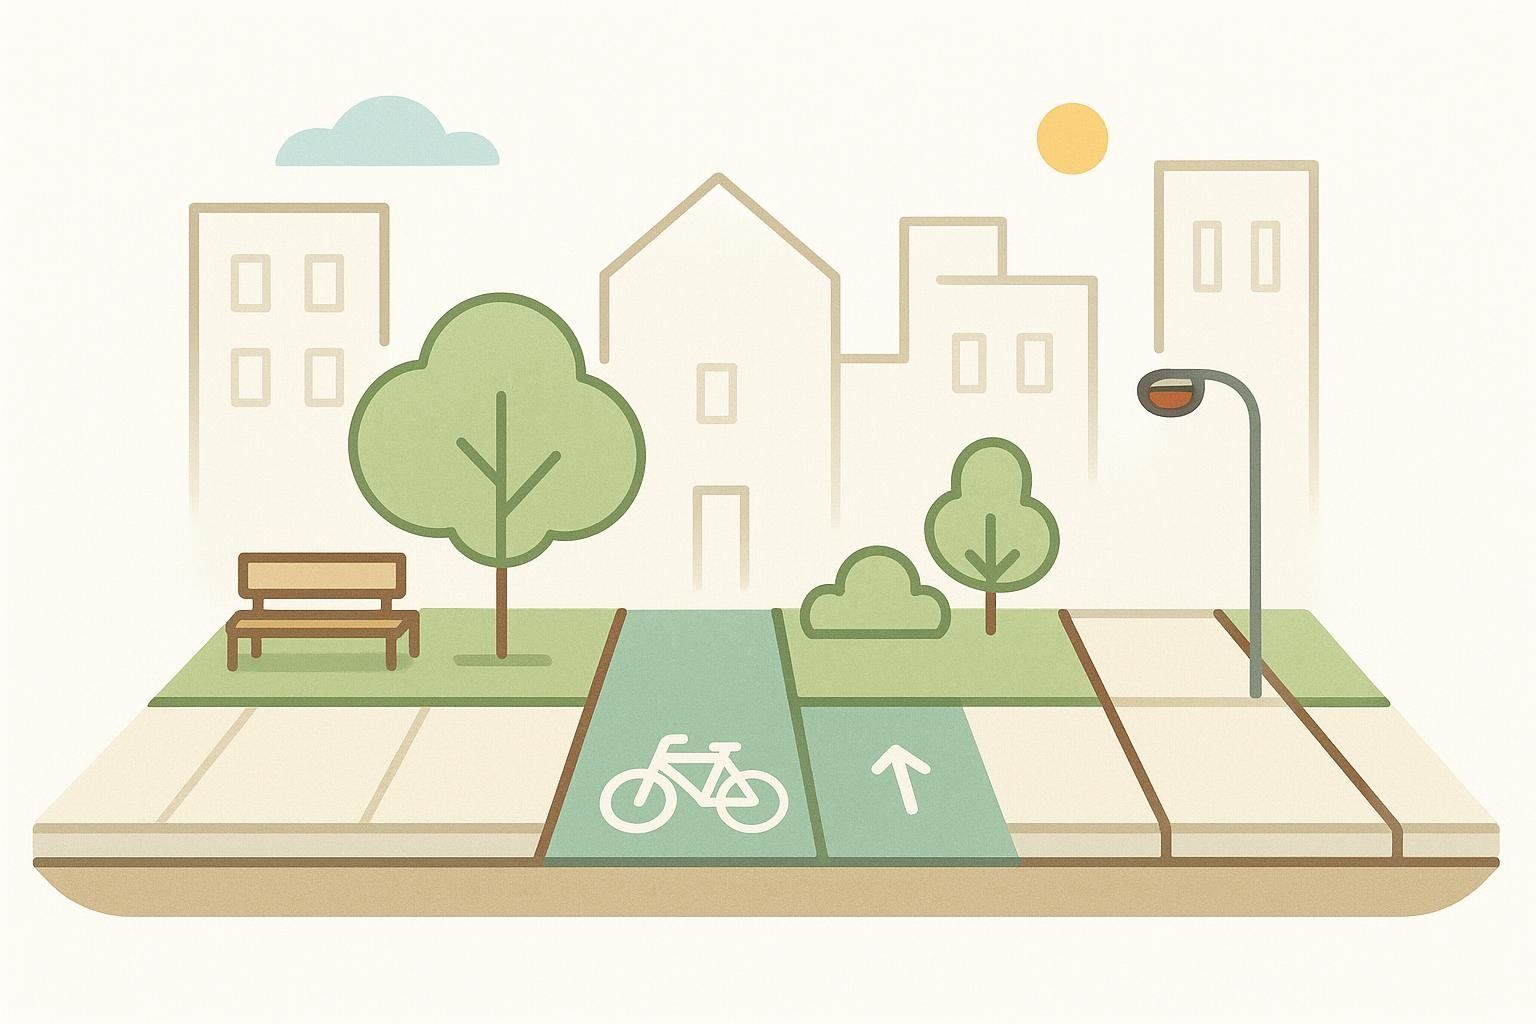
Sidewalk density, bike-lane coverage, and public transit drive routine movement. Research links higher daily step counts to lower visceral fat (PubMed 2024).
3. Activity Culture & Participation

Local sports leagues, running clubs, and outdoor events foster consistent activity. Such zips often appear on the low body-fat end of our preliminary rankings.
4. Recreation & Green Space
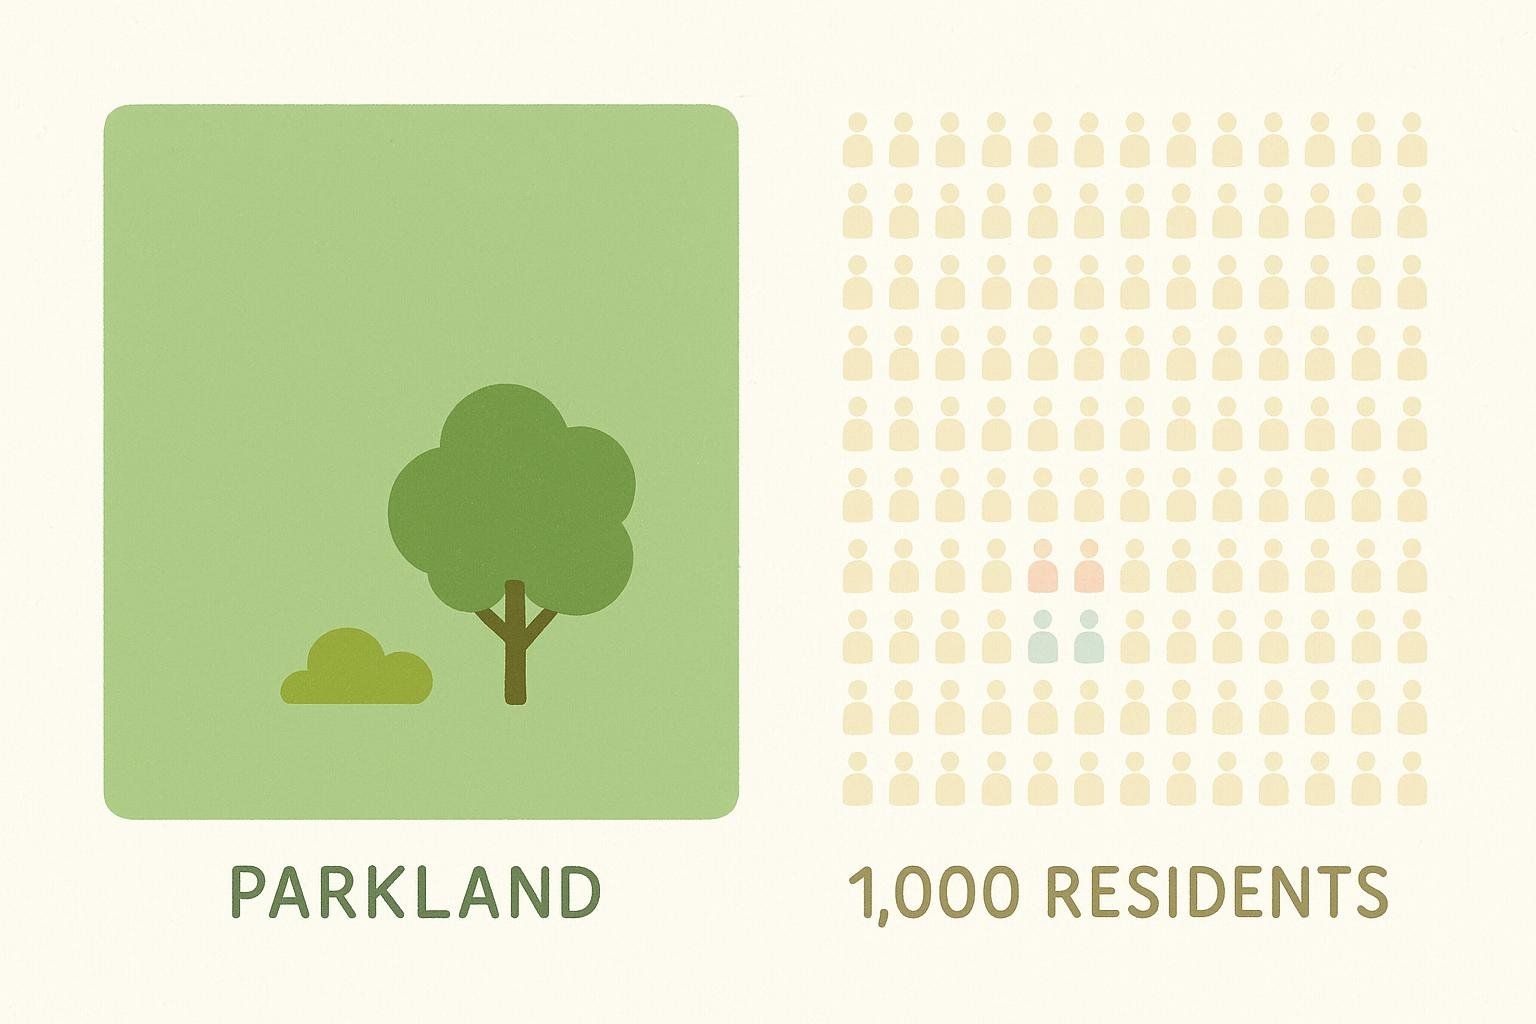
Areas offering ≥ 10 acres of parkland per 1 000 residents show significantly lower PZBFI values—mirroring evidence that green-space proximity reduces obesity risk.
5. Healthy-Food Availability & Dietary Behaviors

Access to farmers’ markets and produce-rich grocers correlates with higher fruit-and-vegetable intake, a known driver of lower body-fat percentage.
6. Healthcare Access & Preventive Screening
Zips with ample primary-care providers see earlier detection of metabolic issues, encouraging lifestyle changes before substantial fat gain.
- Socioeconomic & Educational Attainment

Higher median income and college-degree rates predict lower body-fat levels. Education shapes nutrition knowledge, while income enables gym memberships and—yes—DEXA scans.
How to Put This Preview to Work Right Now
• Relocating? Use the factors above—walkability, park access, healthy-food availability—as a proxy until the full rankings land.
• Public-health pros: Bookmark this methodology to replicate or stress-test with your own GIS layers.
• Realtors: Educate clients on why neighborhood design shapes personal health outcomes.
• Individuals: Environment influences—but doesn’t dictate—results. Track your trajectory with periodic DEXA scans to monitor visceral fat, lean mass, and bone density.
Limitations & Update Schedule
BodySpec scans skew toward health-conscious residents, and some zip codes still lack sufficient sample sizes. We’re incorporating CDC obesity prevalence and demographic controls to offset bias, but expect a ±2-point margin of error in early releases. Updated tables will publish every spring as new DEXA data and public datasets drop.
The Bottom Line
Your zip code can stack the deck for—or against—healthy body composition. But personal choices still matter. Combine neighborhood insight with objective measurements to control the variables you can.
Subscribe to our newsletter—or opt in when you book a DEXA scan—and you’ll get exclusive data visualizations.

